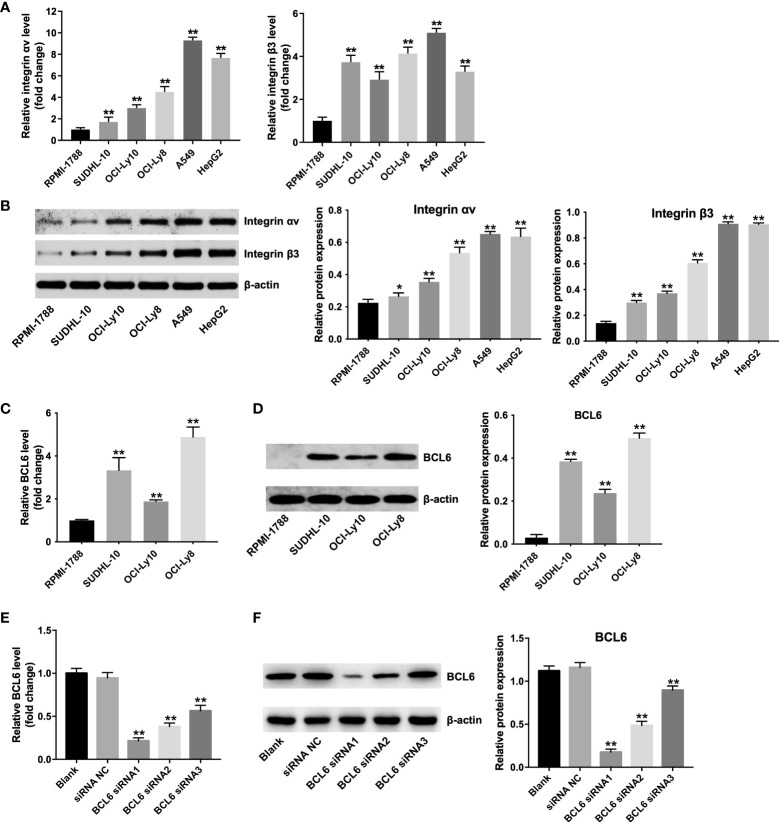
Figure 1.
Predominant αvβ3 integrin expression in DLBCL cells. (A) RT-qPCR and (B) western blot analysis of αv integrin and β3 integrin levels in RPMI-1788, SUDHL-10, OCI-Ly10, OCI-Ly8, A549 and HepG2 cells. *P < 0.05, **P < 0.01 vs. RPMI-1888 group. (C) RT-qPCR and (D) western blot analysis of BCL6 levels in RPMI-1788, SUDHL-10, OCI-Ly10 and OCI-Ly8 cells. **P < 0.01 vs. RPMI-1888 group. (E) RT-qPCR and (F) western blot analysis of BCL6 levels in OCI-Ly8 cells transfected with BCL6 siRNA1, BCL6 siRNA2, or BCL6 siRNA3. **P < 0.01 vs. siRNA NC group. All tests were repeated in triplicate.

