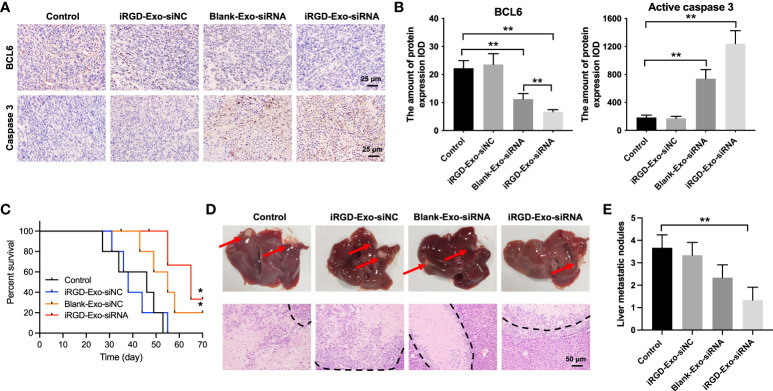
Figure 7.
Tissue analyses. (A, B) IHC analysis of BCL6 and active caspase 3 expressions in tumor tissues collected from nude mice injected with OCI-Ly8 cells and exosomes via tail vein (Scale bar, 25 μm). IOD, integrated optical density. (C) The survival rate of mice are shown. (D, E) Representative images of tumor burdened liver tissues and their HE-stained sections. Red arrows, metastasis nodules in liver tissues. White section, tumor nodules. *P < 0.05, **P < 0.01.

