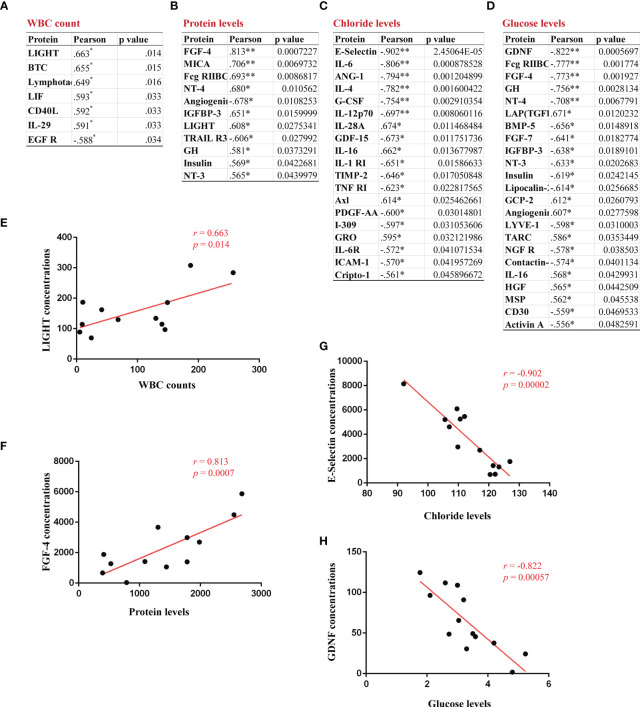
Figure 7.
Identification of correlations between CSF abnormalities and serum proteins in GFAP-A patients. The serum proteins with a significant correlation with CSF levels of WBC count, protein, chloride and glucose are shown in (A–D). (E) A positive correlation between CSF WBC count and the serum concentrations of LIGHT. (F) A positive correlation between CSF protein levels and the serum concentrations of FGF-4. (G) A negative correlation between CSF chloride levels and the serum concentrations of E-selectin. (H) A negative correlation between CSF glucose levels and the serum concentrations of GDNF. Pearson’s correlation analysis was used for statistical analyses, *p<0.05, and **p<0.01 or less was considered significant.

