Figure 1.
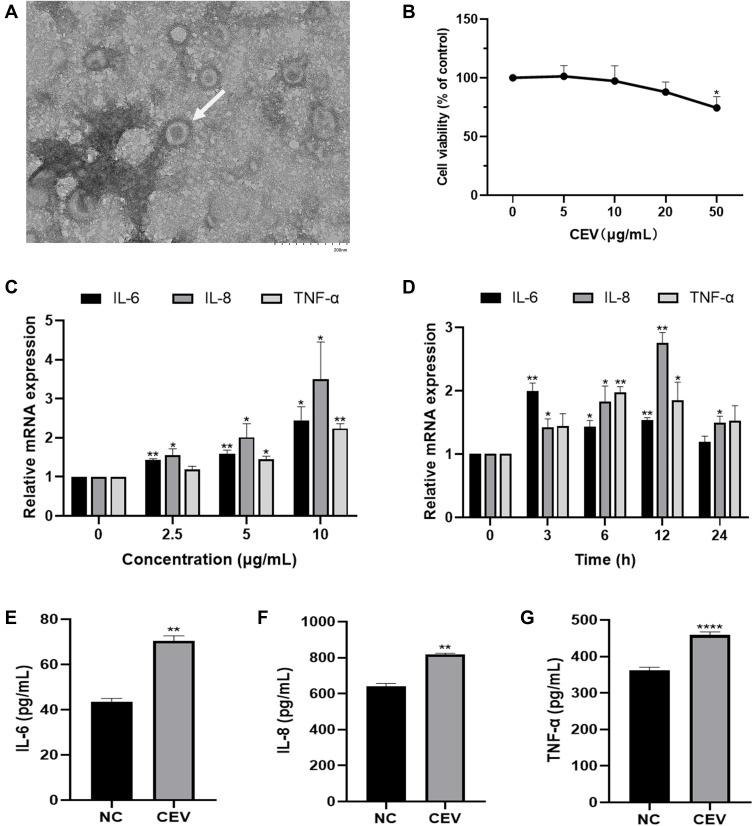
CEVs induced inflammatory response in NHEKs. (A) The morphology of CEVs (white arrow) was observed by TEM. Scale bar, 200 nm. (B) Cell viability of NHEKs 24 h after CEVs stimulation at different concentrations (0, 5, 10, 20, 50 μg/mL) was detected by CCK-8 assay. (C and D) mRNA levels of IL-6, IL-8 and TNF-α following CEVs stimulation at different concentrations (C) and different time points (D) were detected by RT-PCR. (E–G) Protein levels of IL-6, IL-8 and TNF-α in culture supernatants of NHEKs incubated with 10 μg/mL of CEVs for 12 h were detected by ELISA. The data are presented as the mean ± S.E.M. of three independent experiments. *P < 0.05; **P < 0.01; ****P < 0.0001.
Abbreviation: NC, negative control.

