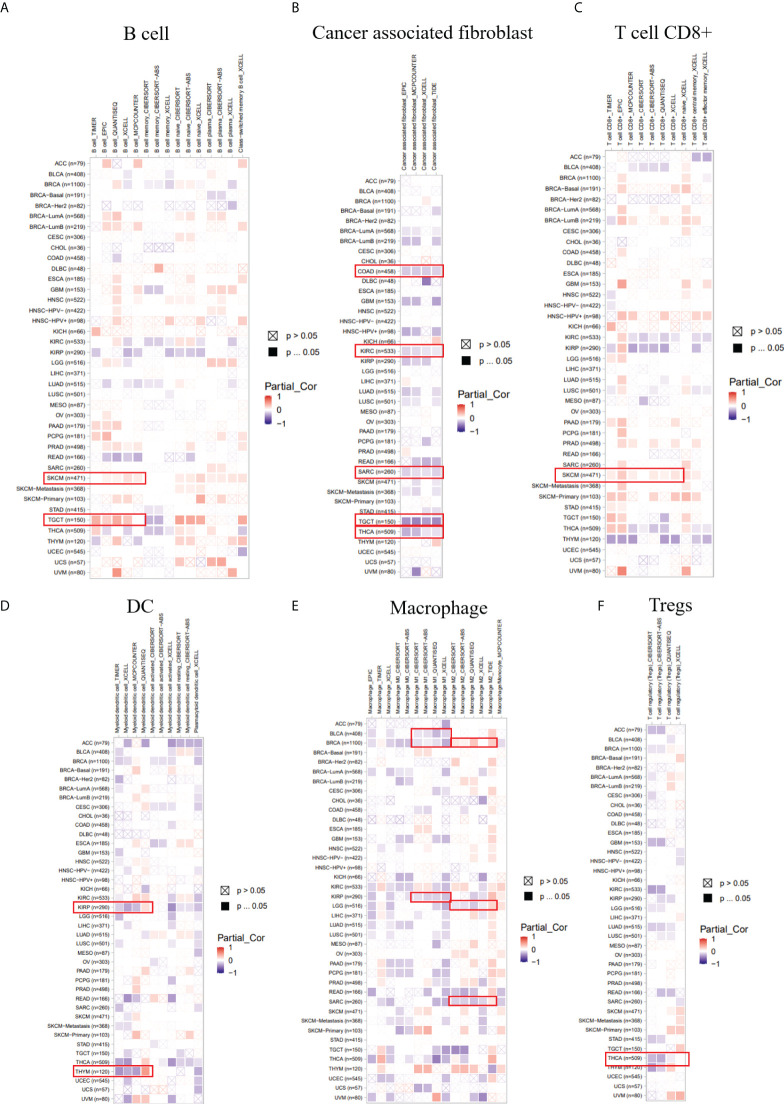
Figure 7.
The correlation between the LIAS expression and several immune cells. (A–F) The TIMER2.0 database depicted the relationship between LIAS expression and immune infiltration of B cell (A), cancer-associated fibroblast (B), T cell CD8+ (C), DC (D), macrophage (E), and Tregs (F) through several algorithms.

