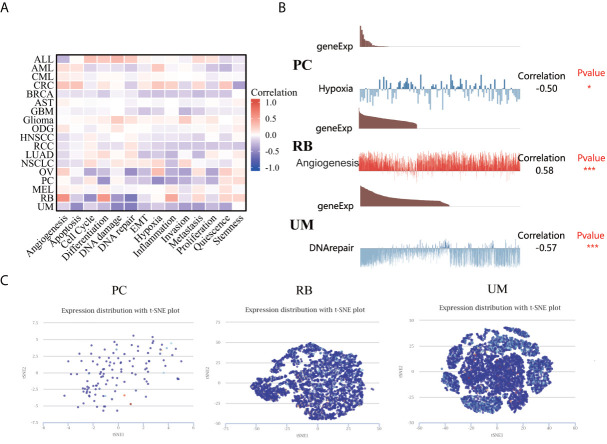
Figure 8.
The expression levels of LIAS at a single-cell sequence level. (A, B) The CancerSEA tool displayed the relationship between LIAS expression and different functional statuses across pan-cancer. (C) The t-SNE diagrams portrayed the distributions of LIAS at single-cell levels from PC, RB, and UM samples.

