Figure 2.
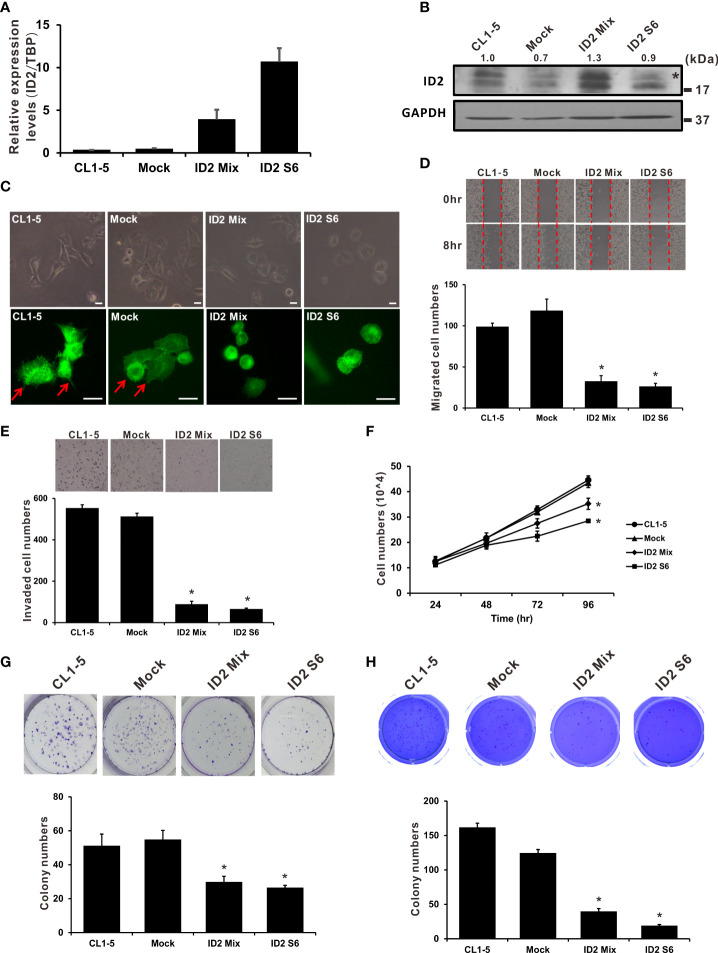
Overexpression of Id2 suppressed highly invasive LADC cells’ aggressive properties. (A) mRNA expression of Id2 in transfected CL1-5 cells measured using qRT-PCR. The control cells (Mock) were pcDNA3.1 vector transfectants. Internal control: TBP. (B) Expression of Id2 protein in the transfectants, measured through Western blot analysis with an antibody against Id2; loading control: GAPDH. *, non-specific band. (C) Representative images of stably expressing Id2 or control vector cells; morphology and immunofluorescence staining of endogenous F-actin. Red arrows indicate the filopodia of cells; scale bar, 20 μm. (D) Scratch wound healing assays for assessing Id2 transfectant cell migratory ability. Eight hours after wound affliction, the cells migrating to the cell-free zone were counted. Data are presented as mean ± SD and represent three independent experiments. *P < 0.05 versus mock control. (E) Transwell assays were used to evaluate mock, Id2, and CL1-5 transfectant invasiveness in three independent experiments. *P < 0.05 versus mock control. (F) Trypan blue exclusion assay for examination of mock, Id2, and CL1-5 transfectant proliferation activity. *P < 0.05 versus mock control. Assays of (G) anchorage-dependent as well as (H) anchorage-independent colony formation were also executed in mock, Id2, and CL1-5 transfectants. *P < 0.05 versus the mock control.

