Figure 3.
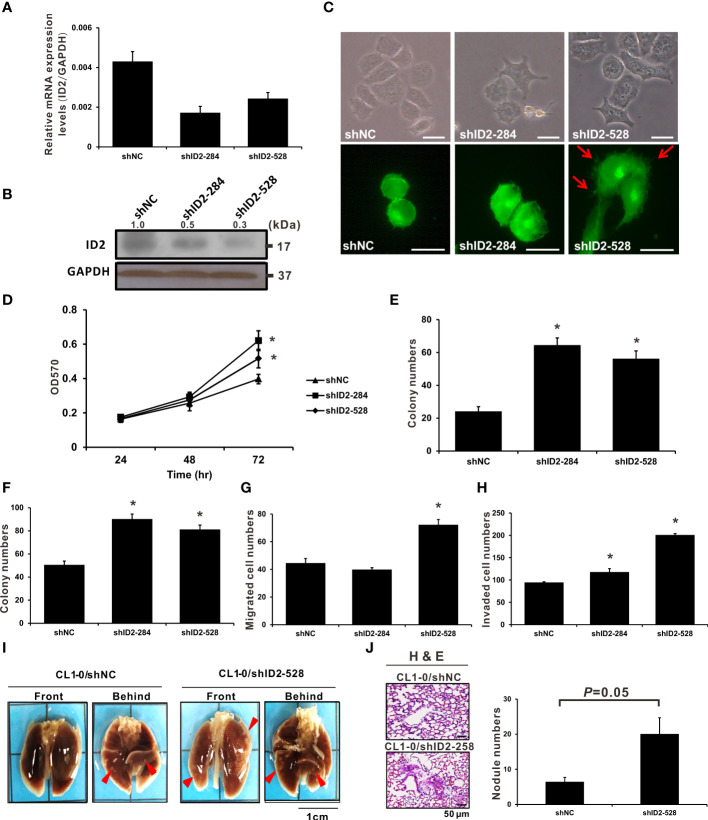
Knockdown of Id2 expression promoted in vitro and in vivo lung adenocarcinoma cell aggressiveness. (A) qRT-PCR and (B) Western blot analysis executed to determine mRNA and protein expression levels, respectively, of Id2 in CL1-0/Id2-knockdown (shID2-284 and shID2-528) and control (shNC) transfected cells. Internal or loading control: GAPDH. (C) Representative Id2-knockdown or shNC cell images revealing their morphology and endogenous F-actin immunofluorescence staining. Red arrows indicate the filopodia of cells; scale bar, 20 μm. (D) MTT assay was performed to assess Id2-knockdown and shNC cell proliferation. *P < 0.05 versus shNC control. (E) anchorage-dependent and (F) anchorage-independent colony formation assays were also performed in Id2-knockdown and shNC cells. *P < 0.05 versus shNC control. (G) Migratory and (H) invasive capabilities of Id2-knockdown and shNC cells, respectively. *P < 0.05 versus shNC control. (I) In vivo tail-vein metastasis assay of Id2 expression in cancer metastasis. Red arrows indicate tumor nodules; scale bar, 1 cm. (J) Histological confirmation through H&E staining. Five mice per group were selected for metastatic tumor nodule counting (P = 0.05); scale bar, 50 μm.

