Figure 9.
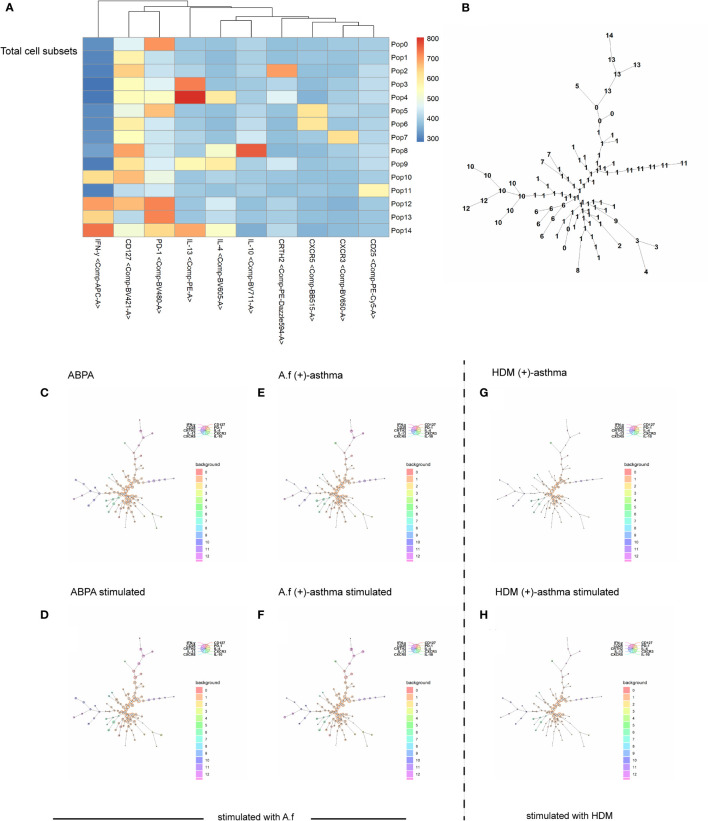
FlowSOM algorithm. Spanning tree visualization of a self-organizing map using compensated flow cytometric data. Data were taken from the lineage (CD3+, CD4+) gate. (A) heatmap of the FlowSOM clustering; (B) minimal spanning tree for 15 metaclusters; (C–H) FlowSOM nodes represent clusters of cells. Metaclusters of the nodes, determined by the map, are represented by the background color of the nodes. A.f (+) asthma, Aspergillus fumigatus-sensitized asthma; HDM (+) asthma, house dust mite-sensitized asthma.

