. 2022 Jun 23;82(16):2928–2939. doi: 10.1158/0008-5472.CAN-21-3106

Figure 4.

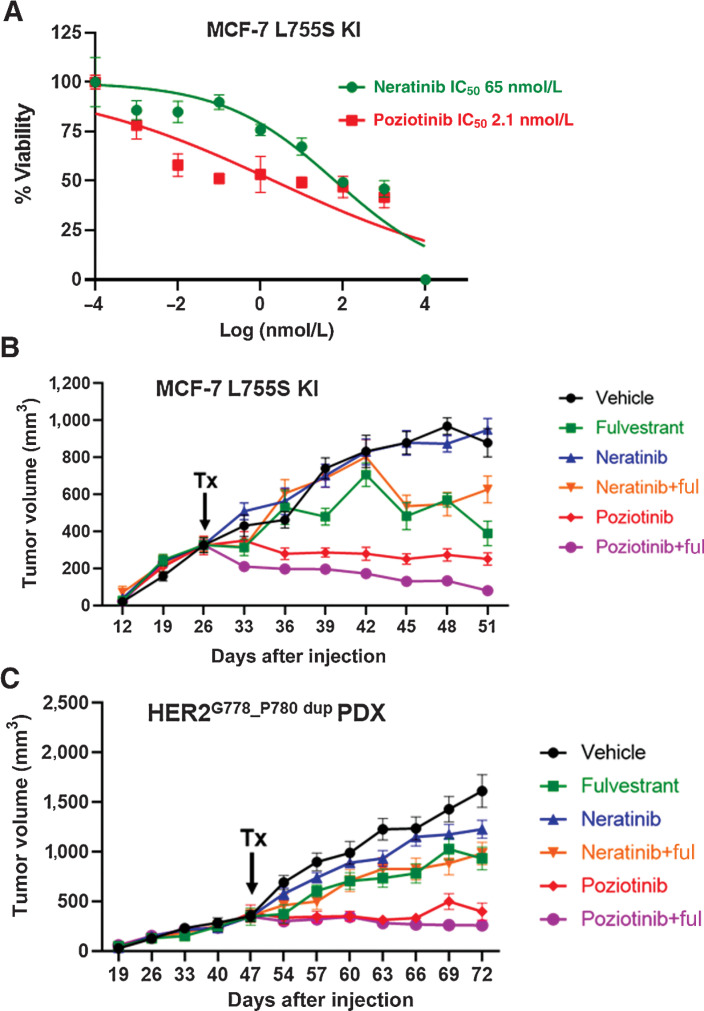
Figure 4. ER+ IDC HCI-003 PDX and ER+ IDC MCF7-L755S KI in vivo models display resistance to neratinib but are sensitive to poziotinib alone or in combination with fulvestrant. A, Dose-response curves for MCF7-L755S KI cells grown in E2-deprived media, to which increasing concentrations of neratinib and poziotinib were added twice a week for 4 weeks. B, MCF7-L755S KI cells or (C) HCI-003 tumors were engrafted into mouse mammary fat pads in the presence of E2 until tumor size reached 300–400 mm3. Subsequently, the E2 supplementation was withdrawn in B, but was continued in C. The mice were randomized in the presence of vehicle or fulvestrant (250 mg/kg/body weight of mice) or neratinib chow (40 mg/kg) or poziotinib chow (10 mg/kg). Tumor volume was measured. The data are plotted as mean tumor volume in mm3 ± SEM, n = 5–8. The significance (P value) of MCF7-L755S KI (B) was calculated on day 51, vehicle vs. poziotinib, <0.0001; vehicle vs. poziotinib + fulvestrant <0.0001; poziotinib vs. neratinib, <0.0001; vehicle vs. neratinib, N.S; vehicle vs. neratinib + fulvestrant, 0.007; vehicle vs. fulvestrant, <0.0001. The significance (P value) of HCI-003 (C) was calculated on day 72, vehicle vs. poziotinib <0.0001; vehicle vs. poziotinib + fulvestrant <0.0001; poziotinib vs. neratinib <0.0001; vehicle vs. neratinib 0.002; and vehicle vs. neratinib + fulvestrant <0.0001.

ER+ IDC HCI-003 PDX and ER+ IDC MCF7-L755S KI in vivo models display resistance to neratinib but are sensitive to poziotinib alone or in combination with fulvestrant. A, Dose-response curves for MCF7-L755S KI cells grown in E2-deprived media, to which increasing concentrations of neratinib and poziotinib were added twice a week for 4 weeks. B and C, MCF7-L755S KI cells (B) or HCI-003 tumors (C) were engrafted into mouse mammary fat pads in the presence of E2 until tumor size reached 300–400 mm3. Subsequently, the E2 supplementation was withdrawn in B, but was continued in C. The mice were randomized in the presence of vehicle or fulvestrant (250 mg/kg/body weight of mice) or neratinib chow (40 mg/kg) or poziotinib chow (10 mg/kg). Tumor volume was measured. The data are plotted as mean tumor volume in mm3 ± SEM, n = 5–8. The significance (P value) of MCF7-L755S KI (B) was calculated on day 51, vehicle vs. poziotinib, <0.0001; vehicle vs. poziotinib + fulvestrant, <0.0001; poziotinib vs. neratinib, <0.0001; vehicle vs. neratinib, no significance; vehicle vs. neratinib + fulvestrant, 0.007; vehicle vs. fulvestrant, <0.0001. The significance (P value) of HCI-003 (C) was calculated on day 72, vehicle vs. poziotinib, <0.0001; vehicle vs. poziotinib + fulvestrant, <0.0001; poziotinib vs. neratinib, <0.0001; vehicle vs. neratinib, 0.002; and vehicle vs. neratinib + fulvestrant, <0.0001.