. 2022 Jun 24;82(16):2838–2847. doi: 10.1158/0008-5472.CAN-22-0554

Figure 2.

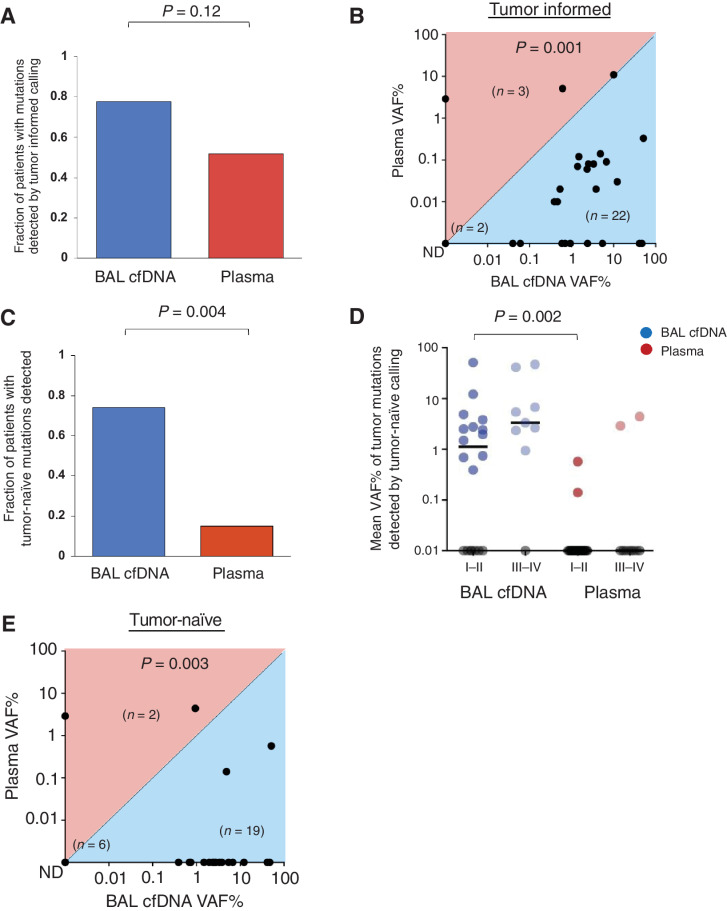
Figure 2. BAL identifies more tumor mutations than plasma. A, Fraction of patients with tumor-derived mutations identified in BAL cfDNA (blue) compared with plasma cfDNA (red) using the tumor informed approach for 27 patients (Supplementary Table S5). B, Mean VAF% in BAL and plasma cfDNA using the tumor-informed approach to identify tumor-derived variants. Each dot represents 1 patient. Numbers of patients in each half of the plot are shown in parentheses within the plot along with the number of samples with no tumor-derived mutations detected. C, Driver mutations identified in BAL cfDNA (blue) compared with plasma cfDNA (red) using the tumor-naïve calling approach for 27 patients (Supplementary Table S7). D, Mean VAF% of mutant DNA detected in BAL cfDNA (blue) or plasma cfDNA (red) by stage using the tumor-naïve calling strategy (P = 0.002). Each dot represents 1 patient and samples with no mutations detected are shown on the x-axis in gray. E, Mean VAF% in BAL and plasma cfDNA using the tumor-naïve approach. Each dot represents 1 patient. Numbers of patients in each half of the plot are shown in parentheses within the plot along with the number of samples with no tumor derived mutations detected. ND, ND, not detected.

BAL identifies more tumor mutations than plasma. A, Fraction of patients with tumor-derived mutations identified in BAL cfDNA (blue) compared with plasma cfDNA (red) using the tumor-informed approach for 27 patients (Supplementary Table S5). B, Mean VAF% in BAL and plasma cfDNA using the tumor-informed approach to identify tumor-derived variants. Each dot represents one patient. Numbers of patients in each half of the plot are shown in parentheses within the plot along with the number of samples with no tumor-derived mutations detected. C, Driver mutations identified in BAL cfDNA (blue) compared with plasma cfDNA (red) using the tumor-naïve calling approach for 27 patients (Supplementary Table S7). D, Mean VAF% of mutant DNA detected in BAL cfDNA (blue) or plasma cfDNA (red) by stage using the tumor-naïve calling strategy (P = 0.002). Each dot represents one patient and samples with no mutations detected are shown on the x-axis in gray. E, Mean VAF% in BAL and plasma cfDNA using the tumor-naïve approach. Each dot represents one patient. Numbers of patients in each half of the plot are shown in parentheses within the plot along with the number of samples with no tumor-derived mutations detected. ND, not detected.