Figure 1.
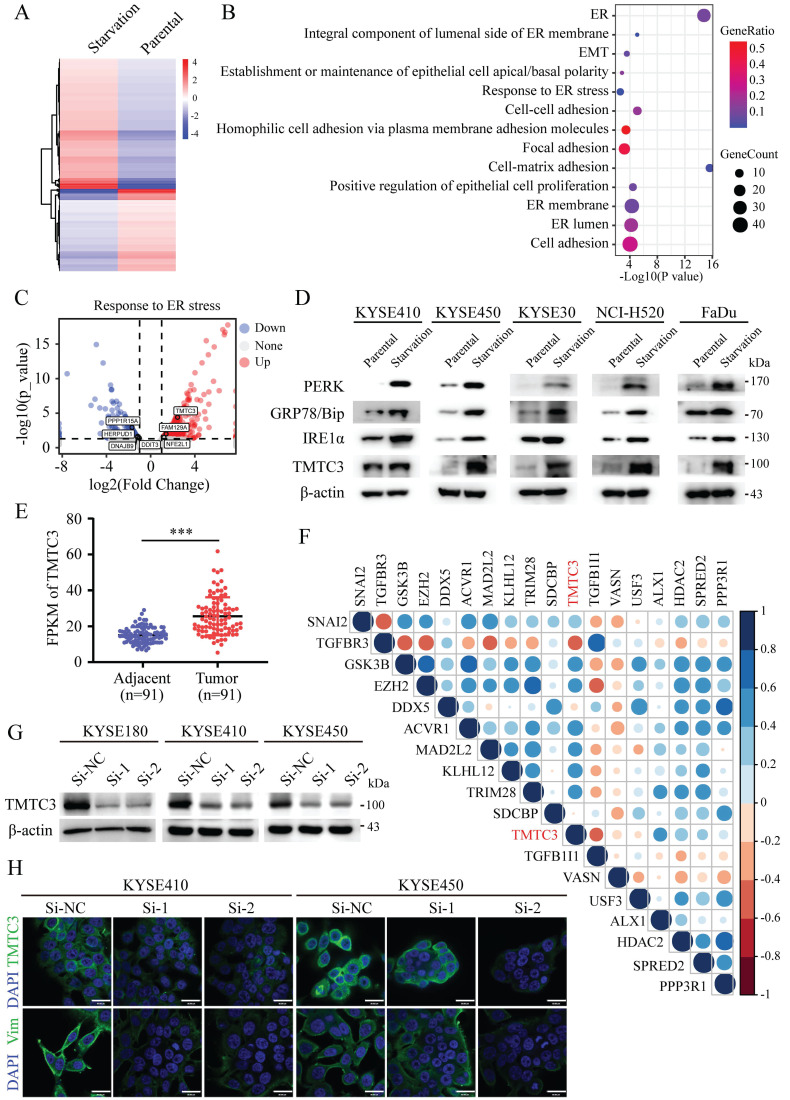
Identification of TMTC3 in cells under ER stress. A. Heatmap of DEGs by RNA-seq of human ESCC cell lines treated with complete medium or medium without amino acids for 48 h. B. Pathways associated with ER were altered in cells cultured without amino acid supplementation. C. Volcano plot for genes involved in ER stress, red for upregulated genes and blue for down-regulated genes. D. The protein levels of ER sensors and TMTC3 in SCCs cells, including ESCC, LUSC, HNSC. E. The FPKM of TMTC3 in transcriptome sequencing data in 91 paired ESCC tumors and adjacent normal tissues. F. Cross correlation analysis of reads between TMTC3 and EMT markers from transcriptome sequencing data in 91 paired ESCC tissues. G. The knockdown efficiency of TMTC3 by siRNA in KYSE180, KYSE410 and KYSE450 cells detected by Western blot. H. Representative IF staining images showing the expression of TMTC3 and Vimentin in KYSE410 and KYSE450 cells. The scale bar represents 30 μm.

