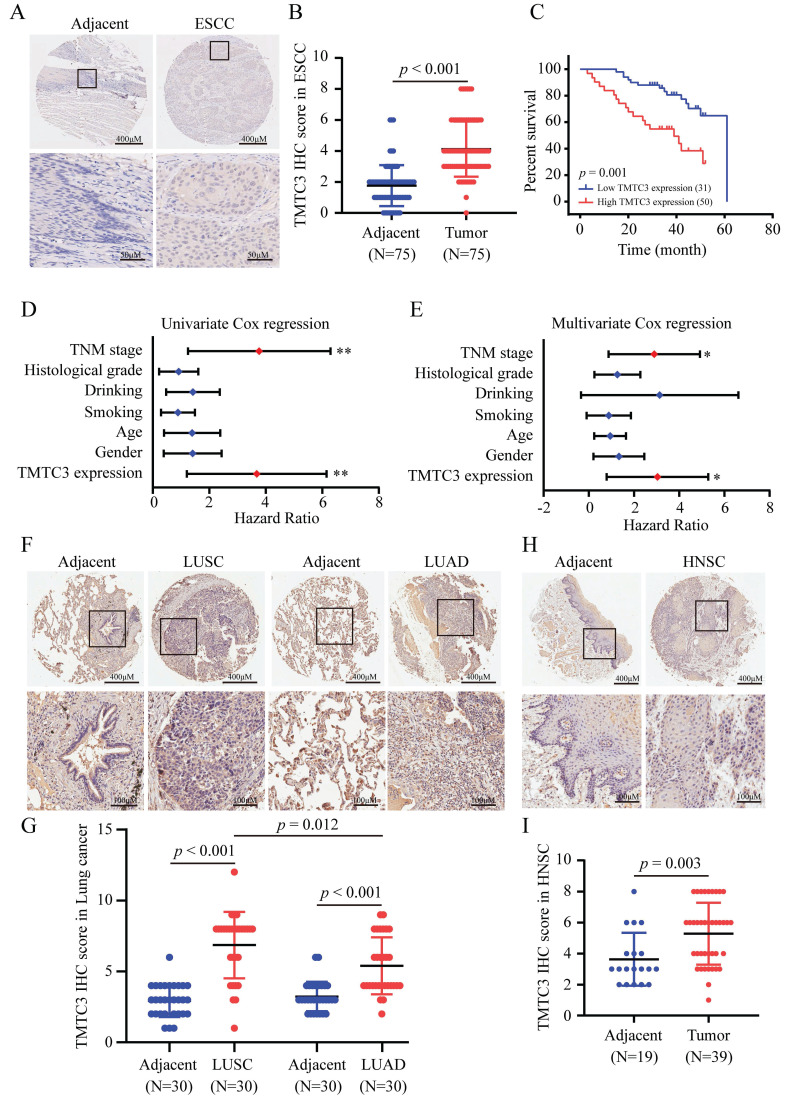
Figure 2.
Ectopic expression of TMTC3 in SCCs tissues. A. Representative IHC images of TMTC3 in the ESCC tissue array. B. IHC staining score for each ESCC tissue spot was calculated based on the intensity and area of the staining for TMTC3. C. High expression of TMTC3 was associated with poor survival in ESCC patients. D and E. Univariate (D) and multivariate (E) Cox regression survival analysis of correlations between overall survival and other clinicopathological features. *, p < 0.05. **, p < 0.01. F and G. Representative IHC images (F) and IHC staining score for TMTC3 (G) in lung cancer tissue array. H and I. Representative IHC images (H) and IHC staining score for TMTC3 (I) in HNSC tissue array.

