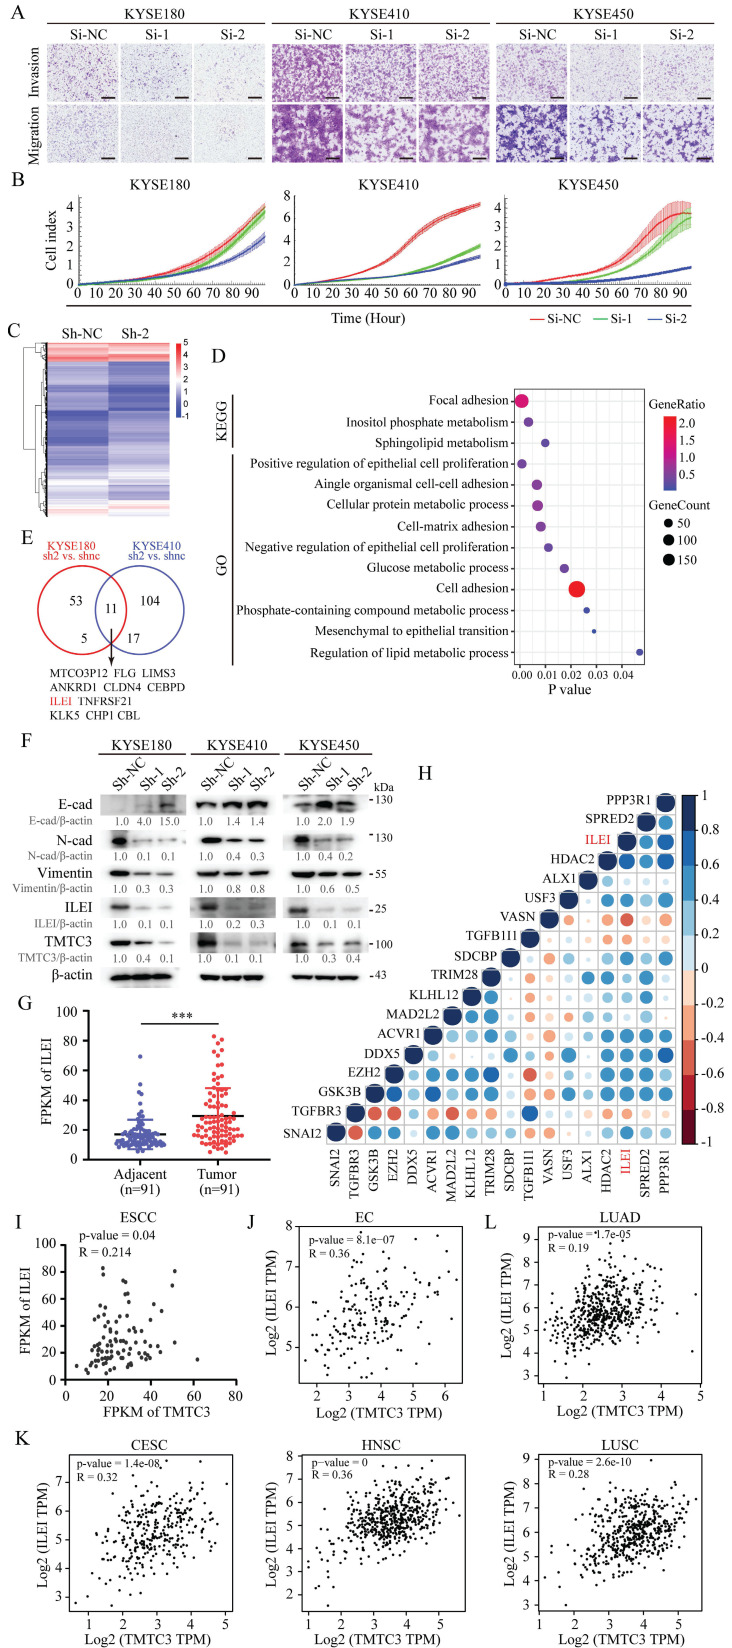
Figure 4.
TMTC3 promoted EMT progress via ILEI. A. The representative images of the Transwell assay in ESCC cells transfected with siRNA for TMTC3. The scale bar represents 500 μm. B. Effects of TMTC3 siRNA on ESCC cell growth via RTCA assays. C. Heatmap of DEGs by RNA-seq in KYSE180 cells stably infected with Sh-TMTC3 or Sh-NC. D. The significantly enriched KEGG pathways and GO terms for DEGs from RNA-seq in TMTC3-knockdown KYSE180 cells. E. Venn diagram of TMTC3 downstream genes from two RNA-seq analysis and 11 genes were selected. F. Western blot analysis for E-cadherin (epithelial marker), N-cadherin and Vimentin (mesenchymal marker) and ILEI in Sh-TMTC3 cells. G. The FPKM of ILEI in transcriptome sequencing data in 91 paired ESCC tumors and adjacent normal tissues. H. Cross correlation analysis of reads between ILEI and EMT markers from transcriptome sequencing data in 91 paired ESCC tissues. I. The positive correlation between TMTC3 and ILEI from transcriptome sequencing data in 91 paired ESCC tissues. J and K. The Pearson's correlation coefficient between TMTC3 and ILEI in EC (J) and other SCCs, including CESC, HNSC, LUSC (K) from GEPIA2 database. L. The correlation between TMTC3 and ILEI in LUAD.

