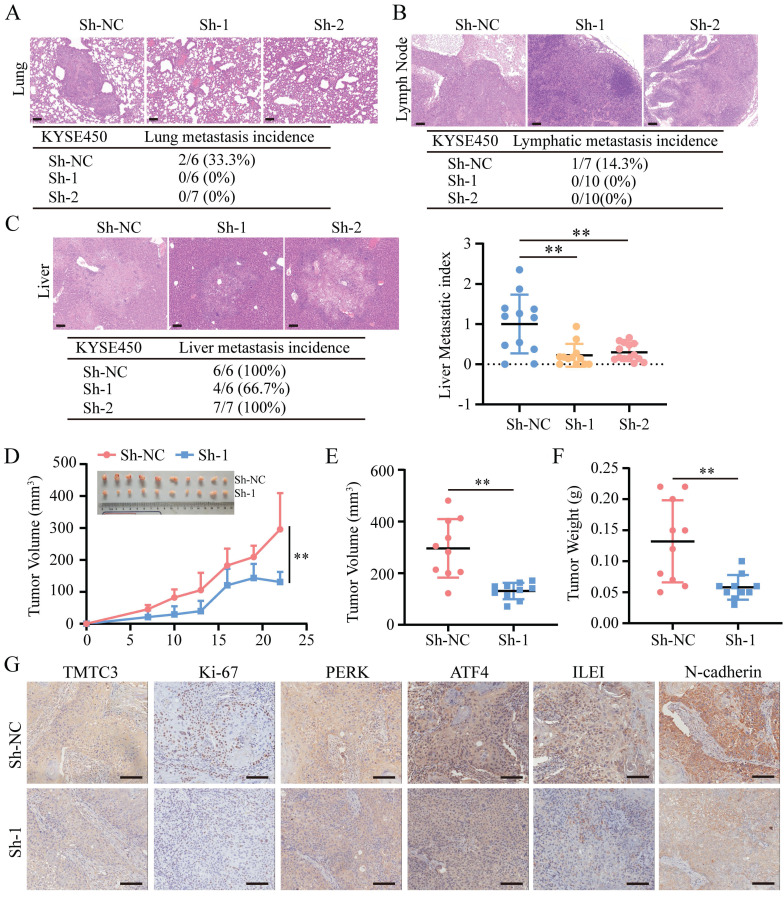
Figure 7.
TMTC3 silencing inhibited tumor metastasis and growth in vivo. A-C. Hematoxylin and eosin (H&E) staining of metastasis to the lung (A), lymph node (B) and liver (C). The scale bar represents 100 μm. The incidence of metastasis including lung, lymph node and liver metastasis, after tail injection. Additionally, the metastatic nodule numbers in the liver were counted. D. Curve analysis of xenograft tumor growth for bearing lenti-Sh-TMTC3 cells and negative control cells. **, p < 0.01. E. The volume of xenograft tumors after mice were sacrificed. **, p < 0.01. F. The xenograft tumor weight of lenti-Sh-TMTC3 cells compared with Sh-NC cells. **, p < 0.01. G. The IHC staining of xenograft tumor for TMTC3, Ki-67, PERK, ATF4, ILEI and N-cadherin. Scale bar, 100 μm.

