Figure 1.
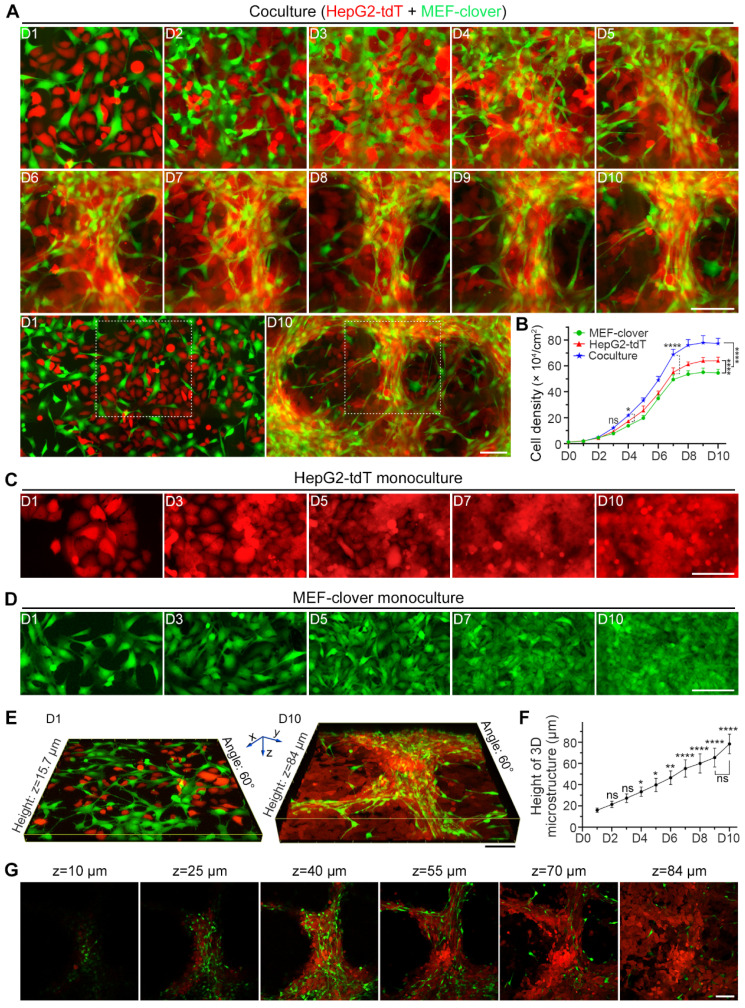
Coculture of HepG2 cells and MEFs led to the formation of 3D multilayer microstructures. (A) Representative live-cell fluorescence images demonstrating the formation of 3D multilayer microstructures from day 1 to day 10. HepG2-tdT and MEF-clover cells were cocultured at a ratio of 1:1. Gridded glass coverslips were employed to take images at the same spots. Zoomed-out views of the images on day 1 and day 10 are shown below. (B) A cell density curve of monoculture and coculture systems from day 1 to day 10. HepG2-tdT and MEF-clover cells were monocultured or cocultured in 2.5 × 10⁵ cells/60-mm culture dishes, and the cell density was assessed every day. Two-way ANOVA and Tukey's multiple comparison test were performed. (C and D) Representative images of monocultured HepG2-tdT (C) and MEF-clover cells (D) at the same spots. (E) Representative 3D XYZ reconstructed images of cocultured cells on day 1 and day 10. Images were generated from Z-stack images taken on a two-photon microscope. (F) A height curve of 3D multilayer microstructures formed during coculture. Height data were extracted from the 3D volume-rendering images. One-way ANOVA and Tukey's multiple comparison test were performed, using the height on day 1 as the reference point. (G) XY-plane images at different heights of a 3D multilayer microstructure formed in coculture on day 10. Scale bars, 100 µm. All data are the mean ± SD from 3 independent experiments. * P<0.05, ** P<0.01, **** P<0.0001, and ns, not significant.

