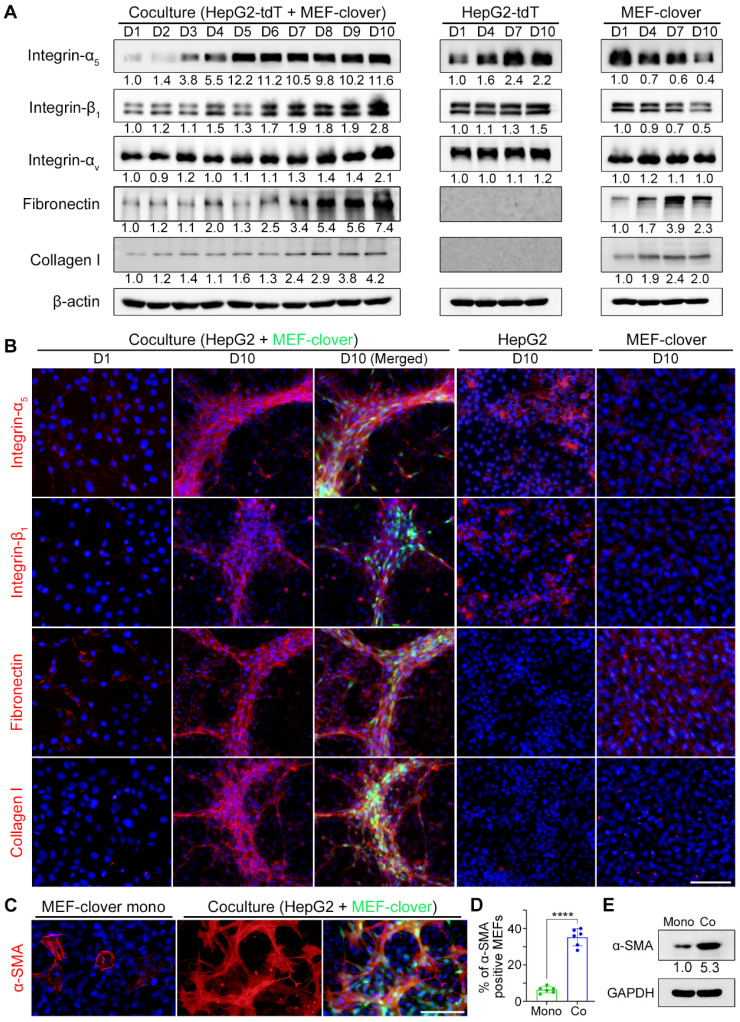
Figure 2.
Integrins and ECM proteins were enriched in 3D multilayer microstructures with more activated fibroblasts. (A) WB results showing the levels of related proteins in cocultured cells and monocultured cells from day 1 to day 10. (B) Representative IF-staining images of related proteins in cocultured cells and monocultured cells. (C and D) Representative IF-staining images of α-SMA in monocultured MEF-clover cells and coculture cells on day 5 (C), and subsequent quantification of the proportion of α-SMA-positive MEFs under two conditions (D). The results were quantified based on the same area in the 20 × observation field (2120 × 1416 pixels, 0.31 µm × 0.31 µm per pixel) from 3 independent experiments, and data are shown as the mean ± SD. Unpaired t test was performed. **** P<0.0001. (E) WB results of the levels of α-SMA in monocultured MEF-clover cells and cocultured cells (HepG2 and MEF-clover cells) on day 10. Nuclei were visualized using Hoechst-33342 staining. Scale bars, 100 µm.

