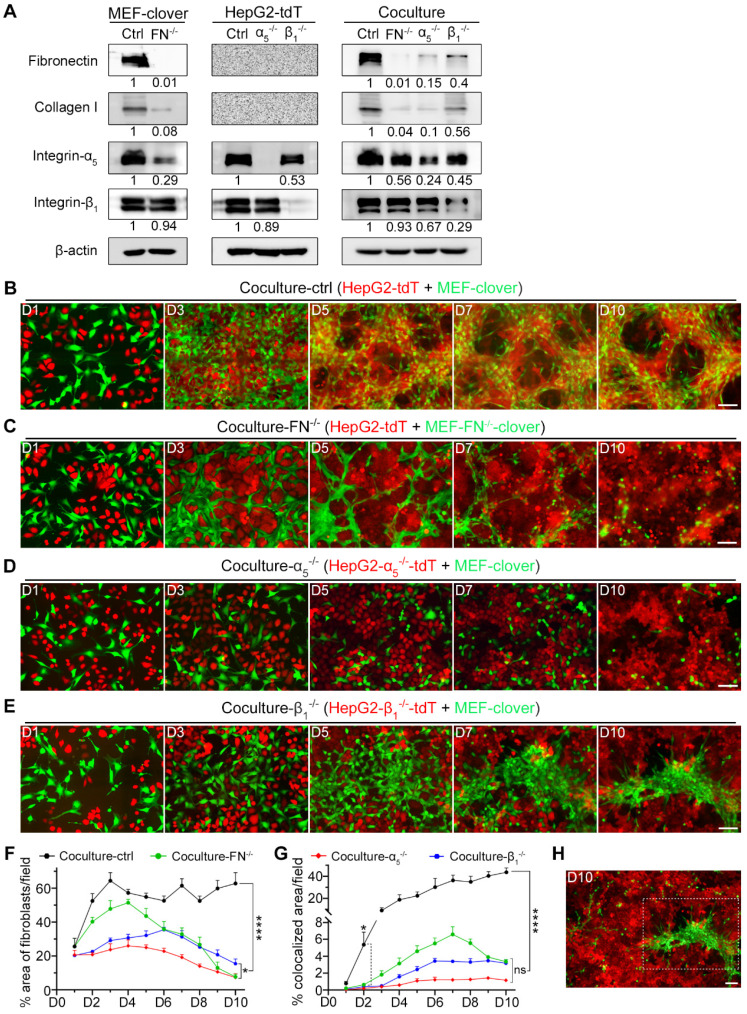
Figure 3.
The formation of 3D multilayer microstructures required fibronectin, integrin-α5, and integrin-β1. (A) WB analysis of the levels of fibronectin, collagen I, integrin-α5, and integrin-β1 in the following samples: MEF-clover cells and MEF-FN-/--clover cells; HepG2-tdT cells, HepG2-α5-/--tdT cells, and HepG2-β1-/--tdT cells; cocultured HepG2-tdT and MEF-clover cells (coculture-ctrl), cocultured HepG2-tdT and MEF-FN-/--clover cells (coculture-FN-/-), cocultured HepG2-α5-/--tdT and MEF-clover cells (coculture-α5-/-), and cocultured HepG2-β1-/--tdT cells and MEF-clover cells (coculture-β1-/-). (B to E) Representative live-cell fluorescence images of coculture-ctrl (B), coculture-FN-/- (C), coculture-α5-/- (D), and coculture-β1-/- (E) groups at the same spots from day 1 to day 10. (F) The percentages of XY-plane growth space occupied by fibroblasts per 10 × observation field (4248 × 2832 pixels, 0.31 µm × 0.31 µm per pixel) were measured using ImageJ in the following four coculture groups: coculture-ctrl, coculture-FN-/-, coculture-α5-/-, and coculture-β1-/-. (G) The percentages of colocalized area between two cell types per 10 × observation field were measured in the four coculture groups with AutoQuant X3 software. (H) Zoomed-out view (10 × observation field) of the image from day 10 in panel e showing the obviously uneven distribution of fibroblasts in coculture-β1-/- group. Scale bars, 100 µm. All data are the mean ± SD from 3 independent experiments. Two-way ANOVA and Tukey's multiple comparison test were performed. * P<0.05, **** P<0.0001, and ns, not significant.

