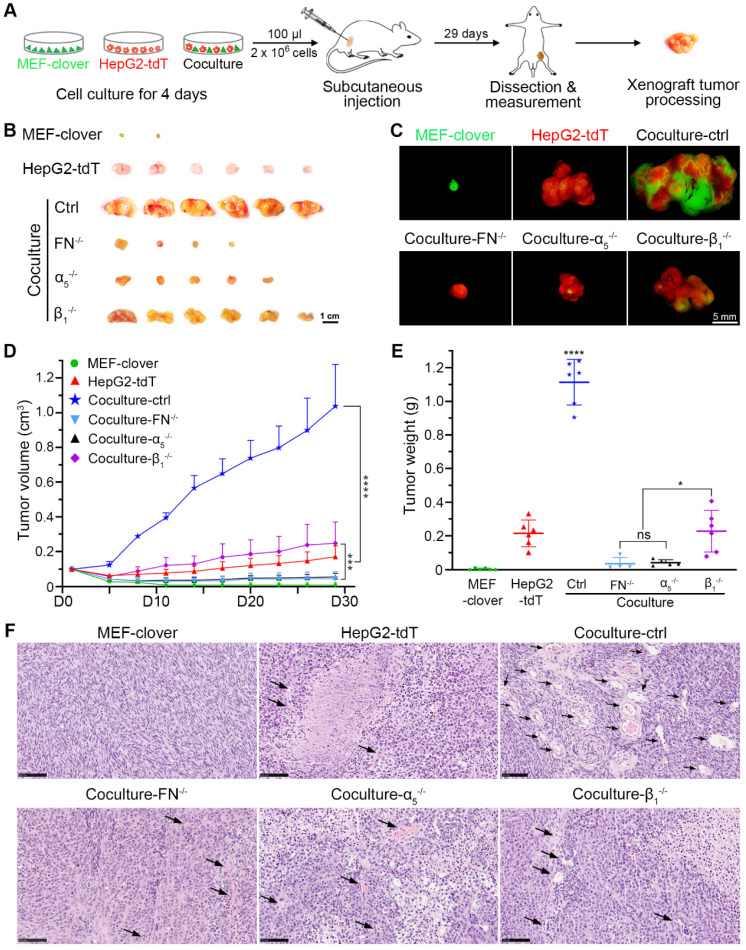
Figure 5.
HIIs-primed HepG2 cells exhibited greater tumor-formation ability than the controls. (A) Schematic of the procedure used to establish the HCC xenograft nude mouse model. Cells in each group were cultured for 4 days before subcutaneous injections. For each mouse, 2 × 10⁶ cells in 100 µl were injected. (B) Representative bright-field images of xenografts in different groups on day 29. Scale bar, 1 cm. (C) Representative fluorescent images of xenografts in different groups on day 29. Scale bar, 5 mm. (D) Quantification of the xenograft tumor volume in different groups. The tumor volume data were obtained every 3 days from day 5 to day 29 (tumor volume was assigned to 0.1 cm3 on day 1). Two-way ANOVA and Tukey's multiple comparison test were performed. (E) Quantification of the xenograft tumor weight in different groups. The tumor weight data were obtained on day 29 after sacrifice and dissection. One-way ANOVA and Tukey's multiple comparisons test were performed. (F) Representative H&E-stained images showing the abundance of blood vessels inside the tumor xenografts in different groups. Scale bars, 100 µm. All data were obtained from 6 mice in each group and are represented as the mean ± SD. * P<0.05, *** P<0.001, **** P<0.0001.

