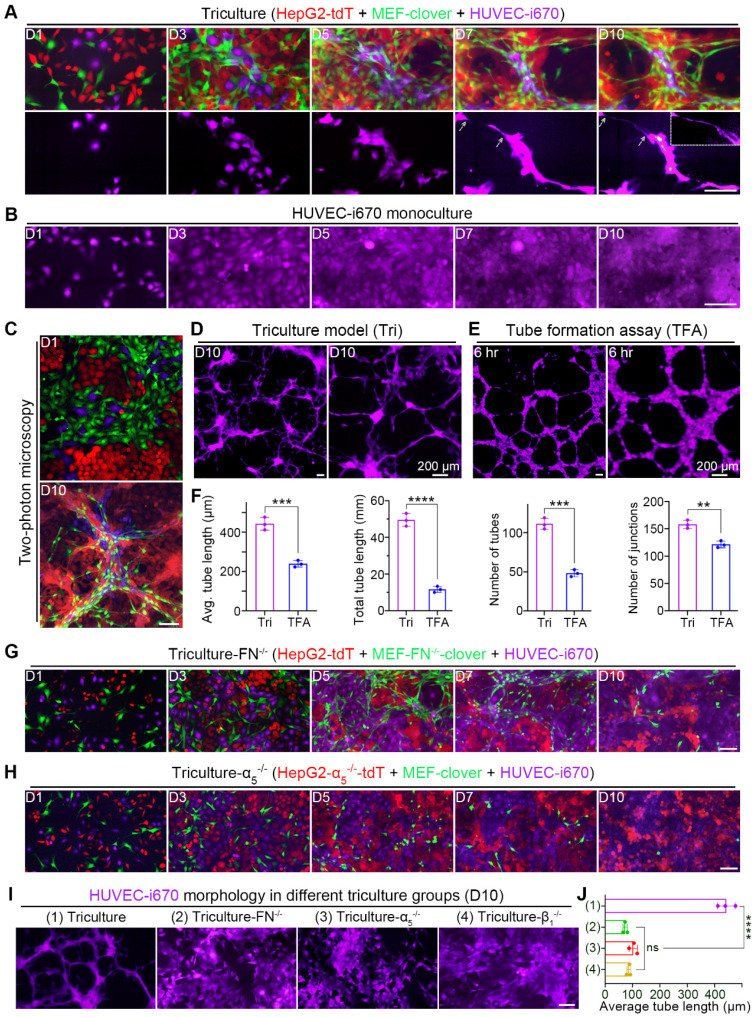
Figure 6.
HUVECs aligned to and elongated along microstructures in triculture. (A) Representative images showing tricultured cells at the same spots from day 1 to day 10. Corresponding HUVEC-i670 morphology is listed below. Zoomed-in image in the right-upper corner on day 10 showing the small tube. Scale bar, 100 µm. (B) Representative images of monocultured HUVEC-i670 cells at the same spots from day 1 to day 10. Scale bar, 100 µm. (C) Representative two-photon images of tricultured cells on day 1 and day 10. Scale bar, 100 µm. (D and E) Representative zoomed-out and zoomed-in images of HUVEC-i670 in triculture on day 10 (D) or HUVEC-i670 after incubation on Matrigel for 6 hr (E). Scale bars, 200 µm. (F) Angiogenic parameters of HUVEC-i670 cells in triculture on day 10 (left) and tube formation assay (TFA) at 6 hr (right). Values were quantified over 5 × observation fields with AngioTool software. Unpaired t test was performed. (G and H) Representative images of the following triculture groups from day 1 to day 10: triculture-FN-/- (G) and triculture-α5-/- (H). Scale bar, 100 µm. (I) Representative images showing HUVEC-i670 morphology in different triculture groups (for triculture-β1-/- group, please refer to Fig. S9E). Scale bar, 100 µm. (J) Quantification of the average tube length of HUVECs in different triculture groups on day 10. Values were quantified over 10 × observation fields. One-way ANOVA was performed. All data are the mean ± SD from 3 independent experiments. ** P<0.01, *** P<0.001, **** P<0.0001, and ns, not significant.

