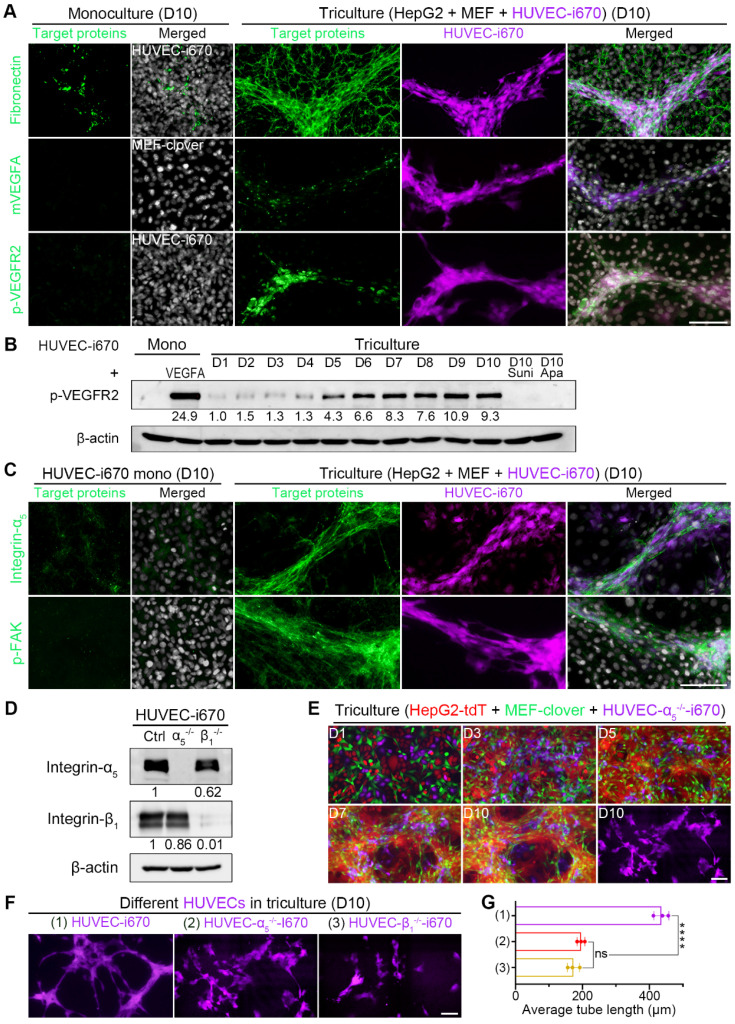
Figure 7.
HUVEC migration to 3D multilayer microstructures enriched with ECM-bound VEGFA required integrin-α5β1. (A) Representative IF-staining images. (B) WB results showing the levels of p-VEGFR2 in monocultured HUVEC-i670 on day 10, the positive control (monocultured HUVEC-i670 with 25 ng/ml rhVEGFA treatment for 5 min), tricultured cells from day 1 to day 10, and the tricultured cells on day 10 administrated with sunitinib (10 nM) or apatinib (10 nM) for 10 days. Drugs were added to the medium beginning on day 2, and the medium was changed daily. (C) Representative IF-staining images. (D) WB analysis showed the levels of integrin-α5 and integrin-β1 in HUVEC-i670, HUVEC-α5-/--i670, and HUVEC-β1-/--i670 cells. (E) Representative fluorescence live-cell images at the same spots. The far-red channel in the right-lower corner shows HUVEC-α5-/--i670 morphology in triculture on day 10. (F) Representative fluorescent images of the following types of HUVECs in triculture with HepG2-tdT and MEF-clover cells on day 10: HUVECs-i670, HUVECs-α5-/--i670, and HUVECs-β1-/--i670 (please refer to Fig. S11C). (G) Quantification of the average tube length of the above types of tricultured HUVECs on day 10. Values were quantified over a 10 × observation field from 3 independent experiments. Data are mean ± SD. One-way ANOVA and Tukey's multiple comparisons test were performed. **** P<0.0001, and ns, not significant. Scale bars, 100 µm.

