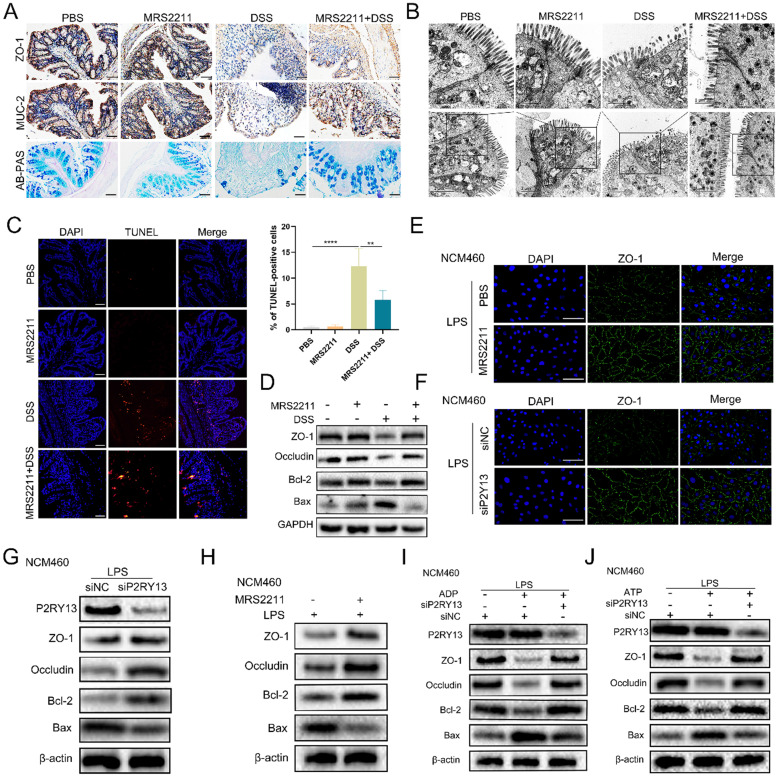
Figure 4.
Activation of P2RY13 can aggravate intestinal mucosal barrier destruction in vivo and vitro. (A-D) Representative images of AB-PAS (×200) and immunohistochemical (×200) of ZO-1 and MUC-2 are shown in (A). Electron micrograph images of colonic segments harvested from mice are shown in (B). Upper scale bar =1 µm. Bottom scale bar = 2 um. TUNEL (×200) staining of colon tissue and Statistical analysis of TUNEL-positive cells are shown in (C). (D) Western blotting was performed to measure the levels of ZO-1, Occludin, Bcl-2 and Bax in colon tissues. Groups are identified as shown. (E-H) NCM460 cells were preincubated with 10 uM of MRS2211 for 1h before being treated with LPS (1 ug/ml) for 24 h. At 24hr after the stimulation of LPS, the immunostained (× 400) with ZO-1 (green) and DAPI (blue) are shown in (E). Western blotting was performed to measure the levels of ZO-1, Occludin, Bcl-2 and Bax are shown in (H). NCM460 cells transfected with P2RY13-targeting siRNA (siP2RY13-2) or nontargeting siRNAs (siNC) and stimulated with LPS, the immunostained (× 400) with ZO-1 (green) and DAPI (blue) are shown in (F). Western blotting was performed to measure the levels of P2RY13, ZO-1, Occludin, Bcl-2 and Bax are shown in (G). (I-J) LPS-primed NCM460 cells transfected with P2RY13-targeting siRNA (siP2RY13-2) or nontargeting siRNAs (siNC) were stimulated with ADP (100 µM) (I) or ATP (100 µM) (J) for 2 h, Western blotting was performed to measure the levels of P2RY13, ZO-1, Occludin, Bcl-2 and Bax. Data represent the means ± SEMs. *p < 0.05; **p < 0.01; ***p < 0.001; ****P < 0.0001.

