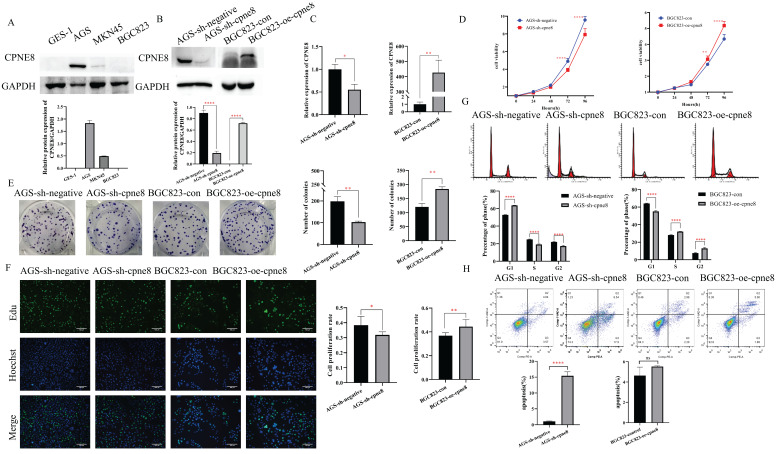
Figure 2.
CPNE8 enhanced the proliferation of GC cells. (A) Western blot plots showing the different expressions of the CPNE8 gene in GC cell lines. Relative protein expression (CPNE8 protein/GAPDH) was quantified in a column graph. (B) CPNE8 knockdown and transfection efficiency in GC cells was analyzed by Western blot and quantified as relative protein expression of CPNE8/GAPDH. (C) The knockdown and transfection efficiency of CPNE8 in GC cells was confirmed by qRT-PCR. The expression of mRNAs was calculated using the 2-ΔΔCt method. (D) CCK-8 assay showed significant differences in GC cell proliferation with knockdown or overexpression of CPNE8, respectively. (E) A colony formation assay assessed the effect of CPNE8 on GC cell proliferation. Colonies were stained with crystal violet, and the number of colonies was counted and shown in a column diagram. Error bars represent mean ± SD from three independent experiments. (F) EDU staining of proliferating cells. GC cells were analyzed using a fluorescence microscope (Olympus-Microsystems). DNA (blue) was stained with Hoechst. Cyan cells show EDU/Hoechst-positive cells. The column diagram represented the proliferation rates in various GC cells. Data are presented as mean ± SD for at least three independent experiments. (G) Cell cycle analysis in GC cells with respective knockdown or overexpression of CPNE8. The bar charts represented the proportion of cells in various cell cycle phases in GC cells. Data are presented as mean ± SD for at least three independent experiments. (H) Analysis of apoptosis in GC cells with knockdown or overexpression of CPNE8. The proportion of apoptotic cells in GC cells was also shown as column graphs. Data are presented as mean ± SD for at least three independent experiments.

