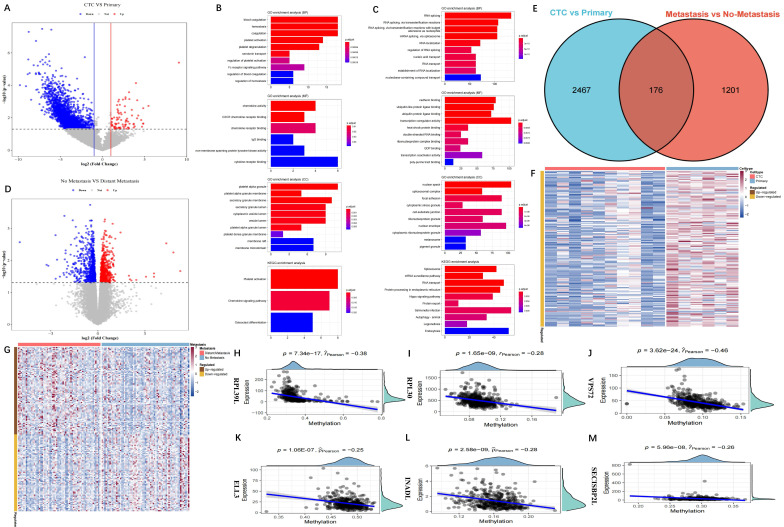
Figure 2.
Identification of methylation-driven DEGs. (A) Volcano map of the DEGs between CTC and primary samples from GSE74639 dataset. There were 2,643 DEGs, including 92 genes up-regulated in CTC samples; (B) Functional enrichment analysis for the 92 genes up-regulated in CTC samples; (C) Functional enrichment analysis for the genes up-regulated in primary samples (BP, MF, CC, KEGG); (D) Volcano map of the DEGs between metastatic and non-metastatic samples from the TCGA-LUAD dataset. There were 1,377 DEGs, including 772 genes up-regulated in metastatic samples and 605 genes up-regulated in non-metastatic samples; (E) Venn diagram of the 2,643 DEGs in CTC vs primary and 1,377 DEGs in metastatic vs non-metastatic. There were 176 overlapping DEGs; (F) Transcriptome profile of the DEGs from GSE74639; (G) Transcriptome profile of the DEGs from TCGA-LUAD; (H-M) Six representative methylation-driven genes, including RPL39L (H), RPL30 (I), VPS72 (J), ELL3 (K), INADL (L) and SECISBP2L (M).

