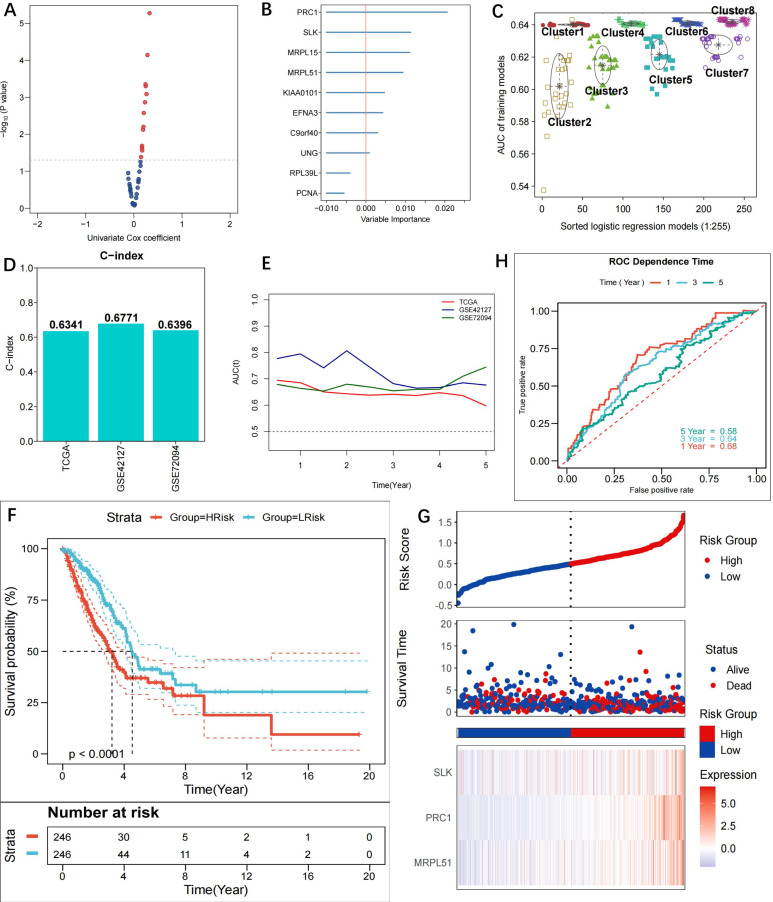
Figure 3.
Construction of prognostic riskscore model based on methylation-driven genes. Scatter plot showing the 10 candidate prognostic genes obtained using uni-variate COX regression analysis (p<0.05); (B) Forest plot showing the importance of the 10 candidate genes, with the RPL39L and PCNA (importance score <0) genes eventually excluded to increase model stability; (C) Different GMMs based on clustering analysis and gene combinations in Cluster 8 identified as optimal in prognosis; (D) C-indexes of the model in TCGA-LUAD (0.6341), GSE42127 (0.6771) and GSE72094 (0.6396); (E) tROC curves for 1-, 3- and 5-year survival in TCGA and GEO cohorts. The 3-gene model (MRPL51, SLK, PRC1) was detected to be prognostic for OS of LUAD patients; (F) KM curves for the model in TCGA-LUAD cohort. Patients in the high-risk group experienced a significantly shorter survival time than patients in the low-risk group (p<0.0001); (G) Riskplot of TCGA patients in the high-risk group and expression of three model genes in high- and low-risk groups; (H) ROC curves for 1-, 3- and 5-year survival in the TCGA cohort (AUC: 0.68, 0.64, 0.58).

