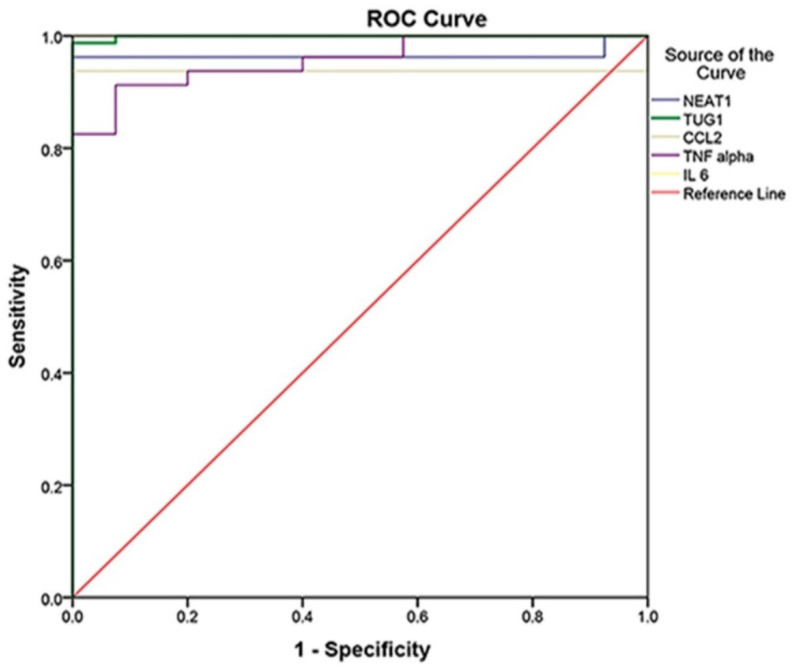
Figure 1.
ROC Curve analysis of markers to differentiate between cases and controls (cases N = 80, controls N = 40, p<0.001), in which IL-6 was the best with 100% sensitivity, 100% specificity, and AUC = 1, followed by TUG 1 with AUC = 0.999, NEAT1 with AUC = 0.965, CCL2 with AUC = 0.938, and TNF- with AUC = 0.957.

