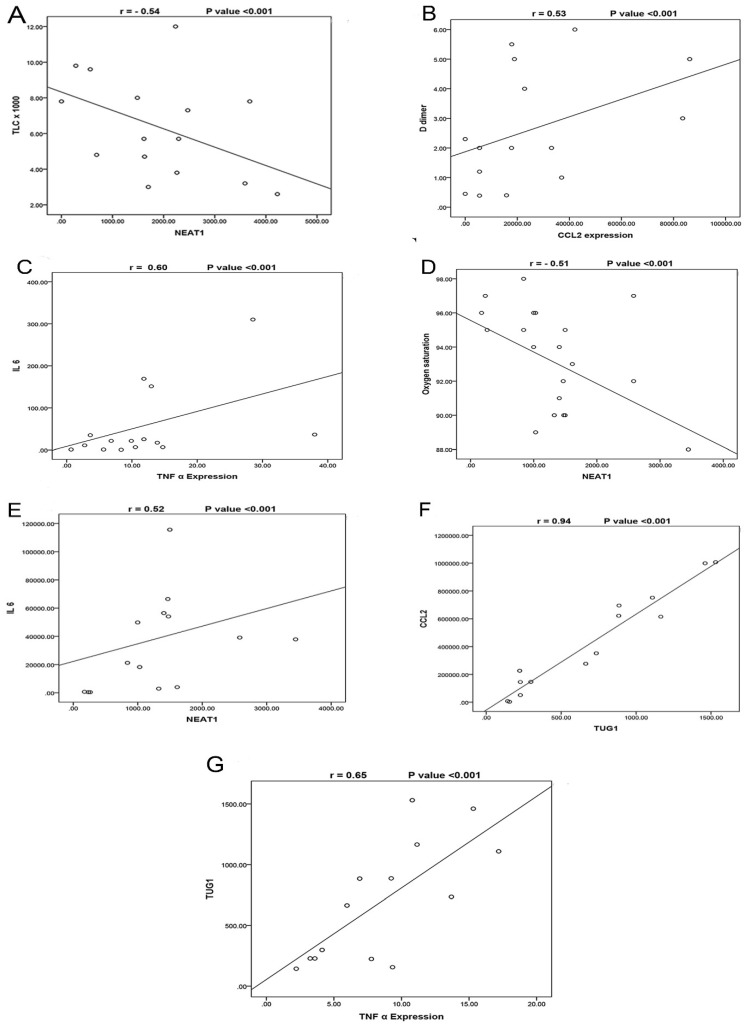
Figure 2.
A- Correlation between NEAT1 expression and TLC in the severe COVID-19 group, which shows a negative correlation (N=35) (r= -0.54, p<0.001). B- Correlation between CCL2 expression and D-dimer in the severe COVID-19 group which shows a positive correlation (N=35) (r= 0.53, p<0.001). C- Correlation between TNF-α expression and IL-6 in the severe COVID-19 group, which shows a positive correlation (N=35) (r= 0.60, p<0.001). D- Correlation between NEAT1 expression and Oxygen saturation in the moderate COVID-19 group, which shows a negative correlation (N=45) (r= -0.51, p<0.001). E- Correlation between NEAT1 expression and IL6 expression in the moderate COVID-19 group, which shows a positive correlation (N=45) (r= 0.52, p<0.001). F- Correlation between TUG1 expression and CCL2 expression in the moderate COVID-19 group, which shows a positive correlation (N=45) (r= 0.94, p<0.001). G- Correlation between TUG1 expression and TNF-α expression in the moderate COVID-19 group, which shows a positive correlation (N=45) (r= 0.65, p<0.001).

