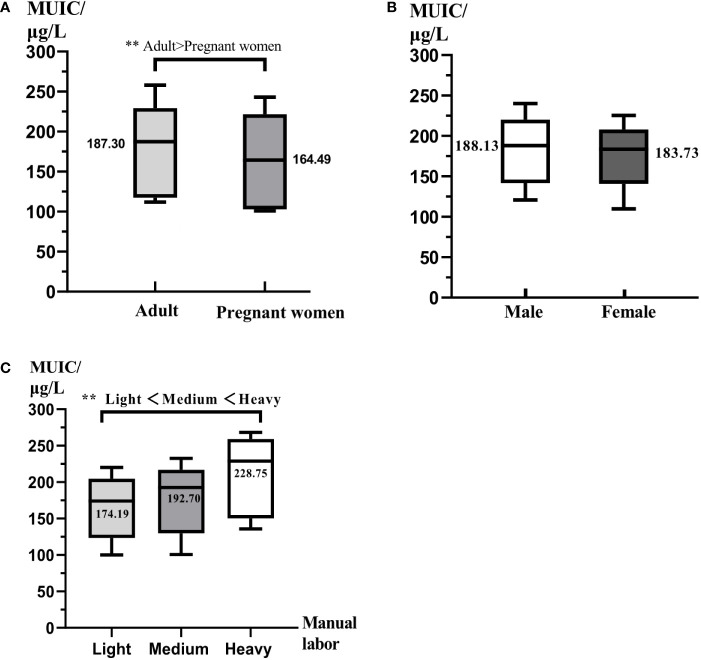
Figure 1.
The comparison of iodine nutrition for different populations. All data were presented as median and interquartile range. MUIC was median urinary iodine concentration. (A) The comparison of iodine nutrition between adults and pregnant women. (B) The comparison of iodine nutrition between men and women. (C) The comparison of iodine nutrition of different labor intensity. ** represents P < 0.01.

