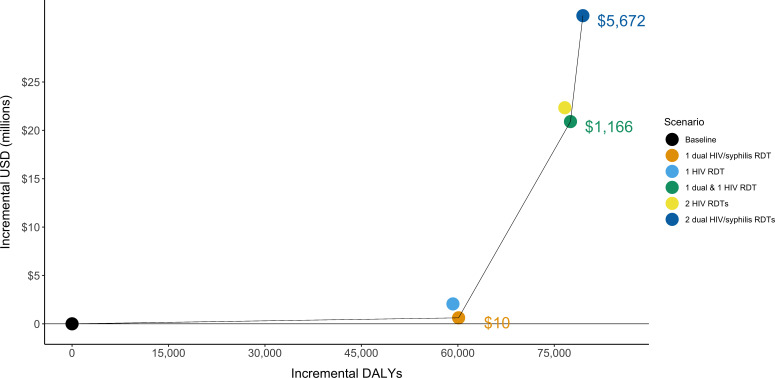
Figure 1.
Efficiency frontier presenting the total disability-adjusted life-years (DALYs) and costs for five testing scenarios among key populations. The solid line indicates the scenarios that are not dominated by other scenarios. Dominated indicates that a scenario is either more costly and less effective or has a higher ICER than a scenario that is more effective. The ICERs for the non-dominated scenarios are shown. ICER, incremental cost-effectiveness ratio; RDT, rapid diagnostic test;.

