
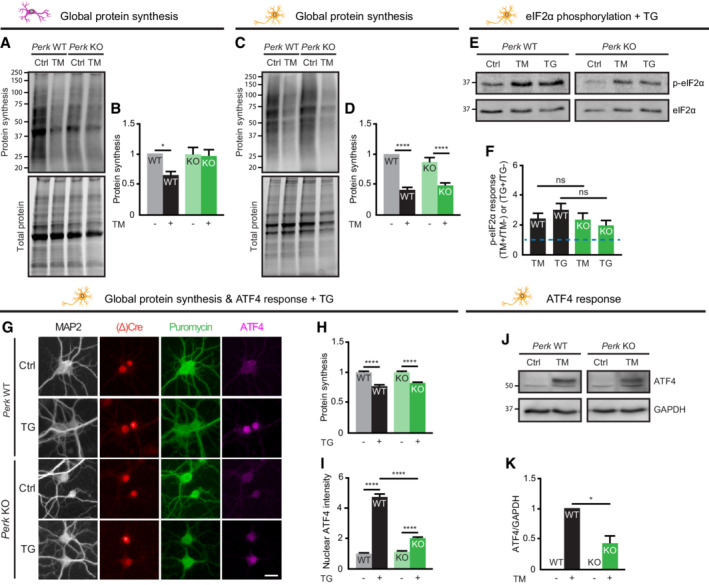
Figure EV3. ER stress‐induced reduction in protein synthesis is preserved in PERK‐deficient neurons—Related to Figs 1 and 2 .
-
A–DProtein synthesis in WT and Perk KO astrocytes (A, B, N = 4) and neurons (C, D, N = 7) ± 20–24 h of TM‐induced ER stress. Representative WB (A, C) and quantification (B, D) of puromycinilated proteins as a measure for de novo protein synthesis. Data are normalised to untreated WT.
-
E–IeIf2α phosphorylation (N = 4), protein synthesis (N = 3) and ATF4 expression (N = 3) in WT and Perk KO astrocytes and neurons ±20–24 h of TG‐induced ER stress. Representative WB (E) and quantification (F) of the ER stress‐induced p‐eIf2α response, relative to untreated cells of the same genotype. Baseline level (without ER stress) is depicted by dashed line. (E) All lanes are from the same gel/blot. (G) Representative images obtained by high‐content microscopy showing puromycinilated proteins and ATF4 immunofluorescence. Dendrites (MAP2, white), nuclei ((Δ)Cre, red), de novo‐synthesised proteins (puromycin, green) and ATF4 (magenta). Scale bar: 25 μm. Quantification of (H) puromycin intensity as a measure for de novo protein synthesis and (I) absolute nuclear ATF4 intensity. Data are normalised to untreated WT.
-
J, KRepresentative WB (J) and quantification (K) of ATF4 expression in WT and Perk KO neurons ±20–24 h of TM‐induced ER stress (N = 4). ATF4 level is corrected for GAPDH level. Data are normalised to TM‐treated WT. (J) All lanes are from the same gel/blot.
Data information: Data are presented as mean ± SEM. N: Biological replicate. Relevant P‐values are indicated: *P < 0.05, ****P < 0.0001 and ns: not significant Statistical analysis: two‐way ANOVA with Tukey's post‐hoc test (B D, F, H, I); one‐sample t‐test with a hypothetical value of 1 (K).
Source data are available online for this figure.