
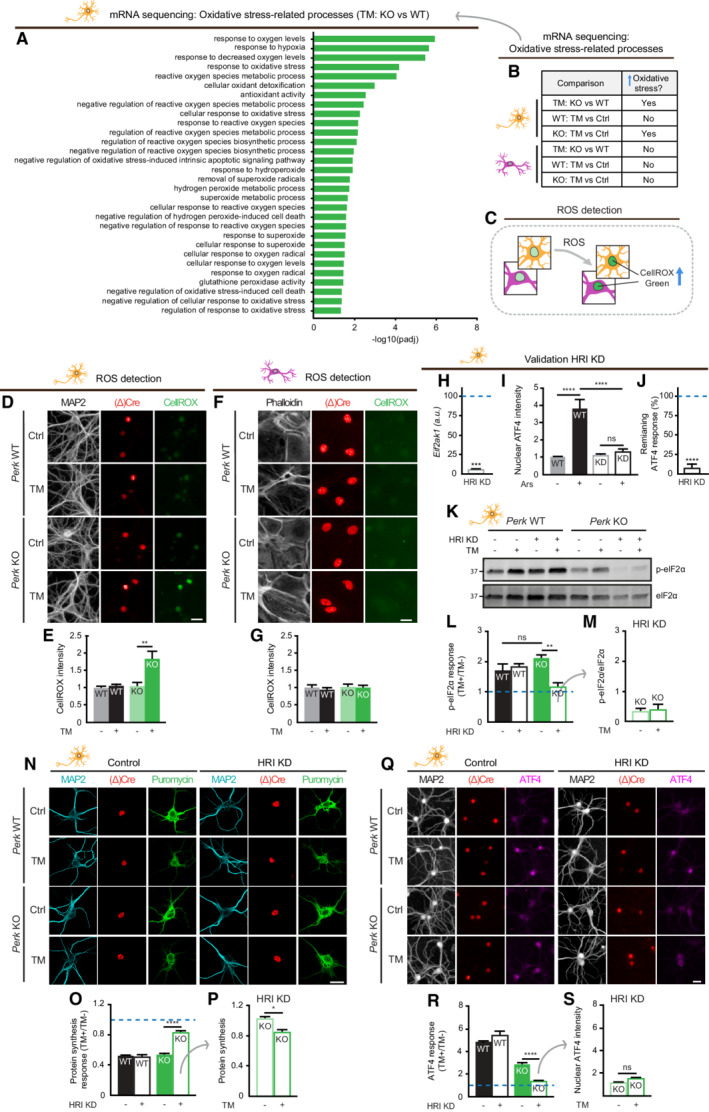
Figure 4. HRI mediates part of the ER stress‐induced translational control in PERK‐deficient neurons.
-
AOxidative stress‐related processes identified by GO analysis comparing TM‐treated Perk KO and WT neurons (N = 3).
-
BOxidative stress‐related processes are only enriched in TM‐treated Perk KO neurons. Source data ((adjusted) P‐values, gene IDs and gene names) are available online.
-
CSchematic representation of the method to quantify ROS accumulation by nuclear CellROX green intensity.
-
D–GROS accumulation in WT and Perk KO neurons (N = 3) and astrocytes (N = 3) ± 20–24 h of TM‐induced ER stress. (D, F) Representative images obtained by high‐content microscopy. Dendrites (MAP2, white), astrocytic soma (phalloidin, white), nuclei ((Δ)Cre, red) and ROS (CellROX green, green). Scale bar: 25 μm. (E, G) Quantification of CellROX green intensity.
-
HmRNA expression of Eif2ak1 (HRI) in HRI KD neurons determined by RT–qPCR, normalised to WT transduced with shRNA control (represented by a dashed line) (N = 3).
-
IQuantification of an increase in nuclear ATF4 intensity in WT neurons ± HRI KD ± 20 h of sodium arsenite (Ars) treatment (N = 3). Representative images are shown in Appendix Fig S5.
-
JThe remaining ATF4 response (%) upon HRI KD, related to ATF4 response of WT transduced with shRNA control (100%, represented by a dashed line) (N = 3). Calculated from data in (I): .
-
K–MeIF2α phosphorylation in HRI KD WT and Perk KO neurons (N = 3) ± 20–24 h of TM‐induced ER stress. Representative WB (K), quantification of the ER stress‐induced p‐eIf2α response (L) and absolute phosphorylated eIF2α level (p‐eIF2α/eIF2α) (M).
-
N–SProtein synthesis (N = 3) and ATF4 expression (N = 4) in HRI KD WT and Perk KO neurons ±20–24 h of TM‐induced ER stress. Representative images obtained by (N) confocal and (Q) high‐content microscopy. Dendrites (MAP2, white/cyan), nuclei ((Δ)Cre, green/red), de novo‐synthesised proteins (puromycin, green), ATF4 (magenta). Scale bar: 25 μm. Quantification of the ER stress‐induced protein synthesis response (O) and puromycin intensity as a measure for de novo protein synthesis (P). Quantification of the ER stress‐induced ATF4 response (R) and absolute nuclear ATF4 intensity (S).
Data information: (E, G, M, P, S) Data are normalised to untreated WT. (L, O, R) Data are related to untreated cells of the same genotype and normalised to WT without HRI KD. Baseline level (without ER stress) is depicted by a dashed line. Data are presented as mean ± SEM. N: Biological replicate. Relevant P‐values are indicated: *P < 0.05, **P < 0.01, ****P < 0.0001 and ns: not significant. Statistical analysis: Two‐way ANOVA with Tukey's post‐hoc test (E, G, I, L, O, R); one‐sample t‐test with a hypothetical value of 100 (H,J); Student's t‐test (M); and nested t‐test (P, S). See also Fig EV5 and Appendix Figs S2 and S4.
Source data are available online for this figure.