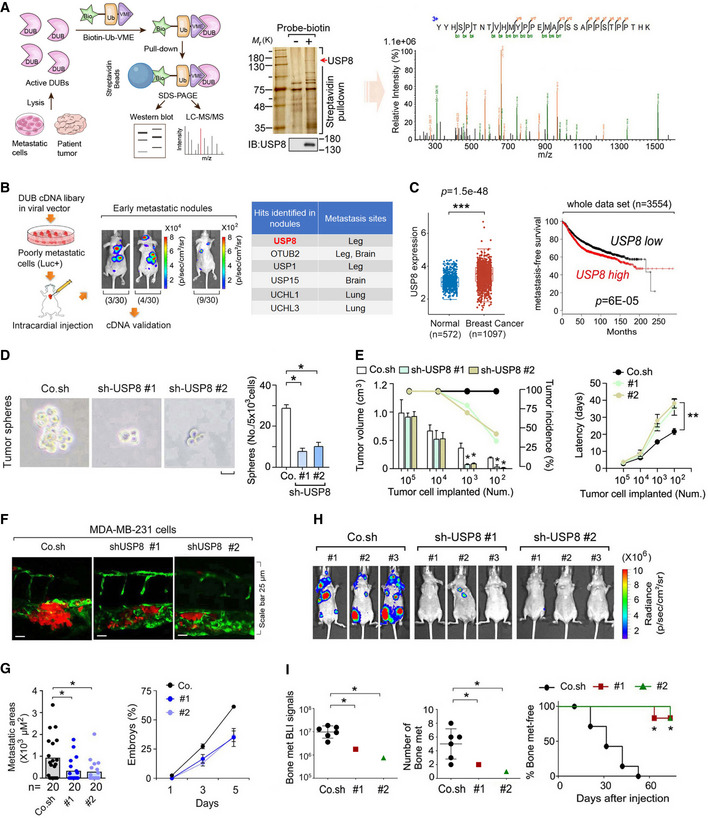
Fig 1. In vivo screening identifies USP8 as a metastasis enhancer.

-
AFlow chart of an in vivo screen to identify active DUBs by using biotin‐Ub‐VME pull‐down assay (left panel), in which the USP8 peptide was identified by mass spectrometry analysis (right panel). Silver staining and immunoblot (middle panel) of precipitants pulled down by biotin‐Ub‐VME probe of MDA‐MB‐231 cells.
-
BExperimental procedure in vivo: flow chart and pictures of an in vivo screen to identify DUBs that promote breast cancer metastasis in mice (left panel). Low metastatic MDA‐MB‐231‐Luciferase/GFP breast cancer cells were infected with viral vectors expressing the DUB cDNAs and subsequently intracardially injected into nude mice. The mice were monitored for 4 weeks by in vivo BLI: of the 30 mice injected with cells expressing the DUB cDNA pool; 3 had metastases in the brain and bone (3/30), 4 had metastases on the back and in the bone (4/30), and 9 had micrometastasis (9/30); the 30 mice injected with control cells showed no detectable metastasis (30/30). Right panel: hints of the identified DUBs were shown.
-
CThe expression distribution of USP8 gene in breast cancer tumor tissues (n = 1,097) and normal tissues (n = 572), where the horizontal axis represents different groups of samples, the vertical axis represents the gene expression distribution (left panel). The box‐and‐whisker plots represent the medians (middle line), first quartiles (lower bound line), third quartiles (upper bound line), and the ±1.5× interquartile ranges (whisker lines). Kaplan–Meier curves show the metastasis‐free survival of individuals was negatively correlated with USP8 expression by log‐rank test (right panel).
-
DMCF10A‐RAS cells infected with control (Co.sh) or USP8 shRNA lentivirus (# 1 and # 2) were analyzed in a tumor sphere assay. The number of mammospheres with a diameter > 60 μm was quantified. The graph shows the number (No.) of tumor spheres per 5 × 10³ cells seeded. Scale bar 50 μm.
-
EMCF10A‐RAS cells infected with control (Co.sh) or USP8 shRNA lentivirus (# 1 and # 2) were subcutaneously injected into nude mice at the indicated numbers. Mean of tumor volumes at week 5 (n = 10 mice for each group).
-
FMicroscopy pictures of representative images of zebrafish tail fin injected with control or USP8 stably depleted MDA‐MB‐231 cells at 5 days postinjection, n = 20 for each group.
-
GThe final invasive areas of zebrafish embryos displaying invasion and experimental metastasis at 5 dpi (left panel); Percentage of embryos injected with control or USP8 stably depleted MDA‐MB‐231 cells (# 1 and # 2) displaying metastasis at 1, 3, and 5 days postinjection (right panel).
-
HBioluminescent images of three representative mice from each group (n = 6) at week 6 were injected into left heart ventricle with control or MDA‐MB‐231 cells stably depleted of endogenous USP8 with two independent shRNA (# 1 and # 2).
-
IBLI signal (left panel), number of bone metastasis of every mouse (middle panel), and the percentage of bone metastasis‐free mice in each experimental group (n = 6 mice per group) followed in time as in (H) (right panel).
Data information: *P < 0.05, **P < 0.01, ***P < 0.001, (two‐tailed Student's t‐test (C (left), D, E (left), G (left), I (left, middle)) or two‐way ANOVA (C (right), E (right), I (right))). Data are analyzed of three independent experiments and shown as mean + SD (D, E (left)) or as mean ± SD (E (right), G, I (left, middle)).
Source data are available online for this figure.
