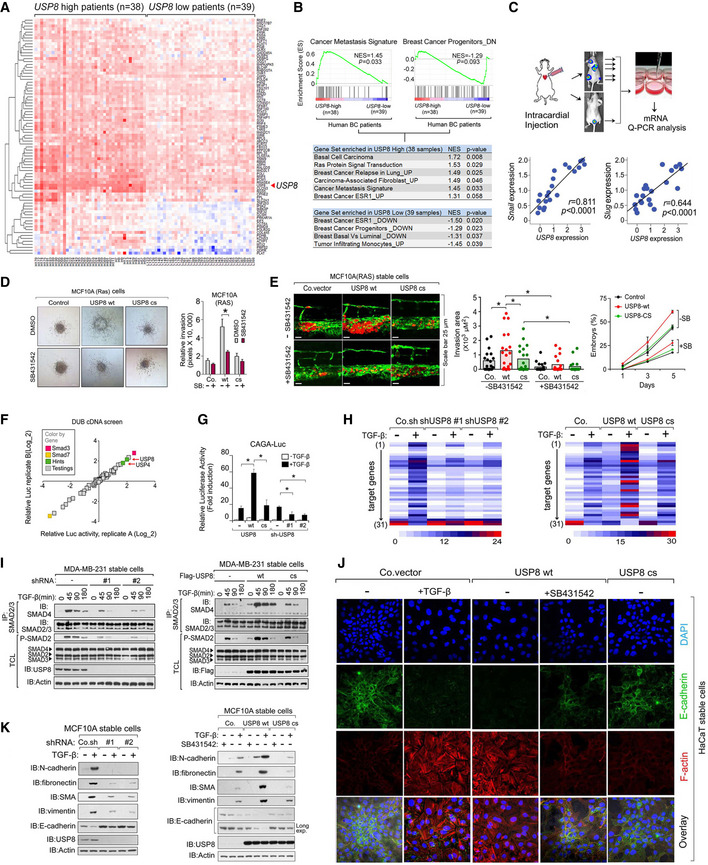
Fig 2. USP8 is a critical component of TGF‐β signaling.

-
AHeatmap of USP8‐correlated genes in a comparison of breast cancer patients with USP8‐high (n = 38) versus with USP8‐low (n = 39).
-
BPreranked gene‐set enrichment analysis (GSEA) in USP8‐high (n = 38) versus USP8‐low (n = 39) breast cancer patients.
-
CExperimental procedure in vivo: MDA‐MB‐231 cells were intracardially injected into nude mice (n = 10). qRT–PCR analysis of bone metastatic cells showing the correlations between USP8 and Snai1 or Snai2 (Slug) in cells isolated from multiple metastatic nodules (n = 21) from mice.
-
D3D spheroid invasion assay of MCF10A‐Ras cells showing USP8 wt increased TGF‐β‐induced invasion. The relative invasion was quantified and shown in the right panel.
-
EMCF10A‐Ras cells stably expressing control vector (Co.vec), USP8 wt, or USP8 cs were injected into the blood circulation of 48‐hpf zebrafish embryos. SB431542 (5 μM) was added to the zebrafish environment. Representative images of zebrafish at 5 dpi (left panel); the experimental metastatic areas (middle panel) and percentage of embryos showing metastasis (right panel) are shown, n = 20.
-
FDiagram of DUB cDNA screening data of TGF‐β‐induced SMAD3/ SMAD4‐dependent CAGA12‐Luc transcriptional reporter in HEK293T cells. The X‐ and Y‐axes are the relative luciferase activity in two replicates.
-
GCAGA12‐Luc transcriptional response of HEK293T cells transfected with USP8 wt/cs or shUSP8 (#1 and #2) as indicated and treated with TGF‐β (1 ng/ml) overnight.
-
HHeatmap of TGF‐β target genes by qRT–PCR analysis in control or MCF10A‐RAS cells stably depleting USP8 (#1 and #2 shRNA) or expressing USP8 wt/cs and treated with or without TGF‐β (2.5 ng/ml) for 8 h. Appendix Table S2 for details.
-
IImmunoblot analysis of total cell lysates, immunoprecipitates derived from control and USP8 stably depleted (#1 and #2 shRNA) (left panel) and USP8 wt/cs overexpressed (right panel) MDA‐MB‐231 cells treated with TGF‐β (2.5 ng/ml) for indicated time points.
-
JImmunofluorescence and 4, 6‐diamidino‐2‐phenylindole (DAPI) staining of HaCaT cells infected with control or USP8 wt/cs and treated with TGF‐β (2.5 ng/ml) and SB431542 (10 μM) for 72 h. Scale bar, 20 μm.
-
KImmunoblot analysis of cell lysate of control and USP8 stably depleted‐MCF10AR‐RAS (MII) cells treated with TGF‐β (5 ng/ml) for 48 h (left); Immunoblot analysis of cell lysate of control and USP8 wt or USP8 cs stably expressed‐MCF10AR‐RAS (MII) cells treated with TGF‐β (5 ng/ml) or SB431542 (10 μM) for 48 h (right).
Data information: *P < 0.05 (two‐tailed Student's t‐test (D, E (middle), G) or two‐way ANOVA (C, E (right), F)). Data are representative of at least three independent experiments and shown as mean + SD (D (right), G); Data are shown as mean ± SD (E (right)).
Source data are available online for this figure.
