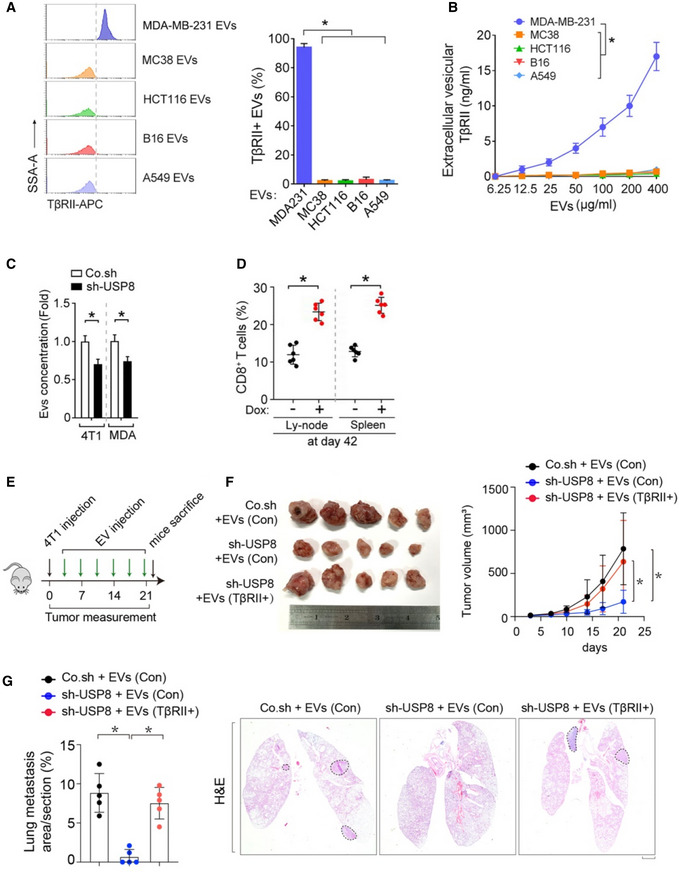
Fig EV2. Loss of USP8 increases the percentage of CD8+ T cells from lymph nodes and spleen.

-
AFACS analysis (left) and Quantification of TβRII in purified EVs from various types of cancer cell lines: metastatic bresat cancer cells (MDA‐MB‐231), colorectal cancer cells (MC38 and HCT116), melanoma B16 or lung cancer cells (A549).
-
BELISA analysis of TβRII in purified EVs from various types of cancer cell lines: metastatic bresat cancer cells (MDA‐MB‐231), colorectal cancer cells (MC38 and HCT116), melanoma B16 or lung cancer cells (A549).
-
CEVs concentration by nanosight of 4T1 and MDA‐MB‐231 cells infected with lentivirus encoding control shRNA (Co.sh) or USP8 shRNA.
-
DQuantification of the percentage of TβRII+ EVs in plasma samples from mice at day 42.
-
E–GExperimental analysis in vivo: BALB/c mice were nipple injected with control and USP8 stably depleted‐4T1 cells (5 × 10⁵ cells per mouse), followed by tail vein‐injection of Co.EVs or TβRII+ EVs (50 μg per mouse every other day) for 3 weeks (n = 5 per group) (E). Bright view of primary tumor from each group at week 3 (left) and tumor volume measured in time (right) (F). Percentage of lung metastasis area of all mice (left) and representative HE stained lung sections (right) from each group at week 3 (G). Scale bar, 1 mm.
Data information: *P < 0.05 (two‐tailed Student's t test (A, C, D, G) or two‐way ANOVA (B, F)). Data are shown as mean + SD (A, C) or as means ± SD (B, D, F, G).
