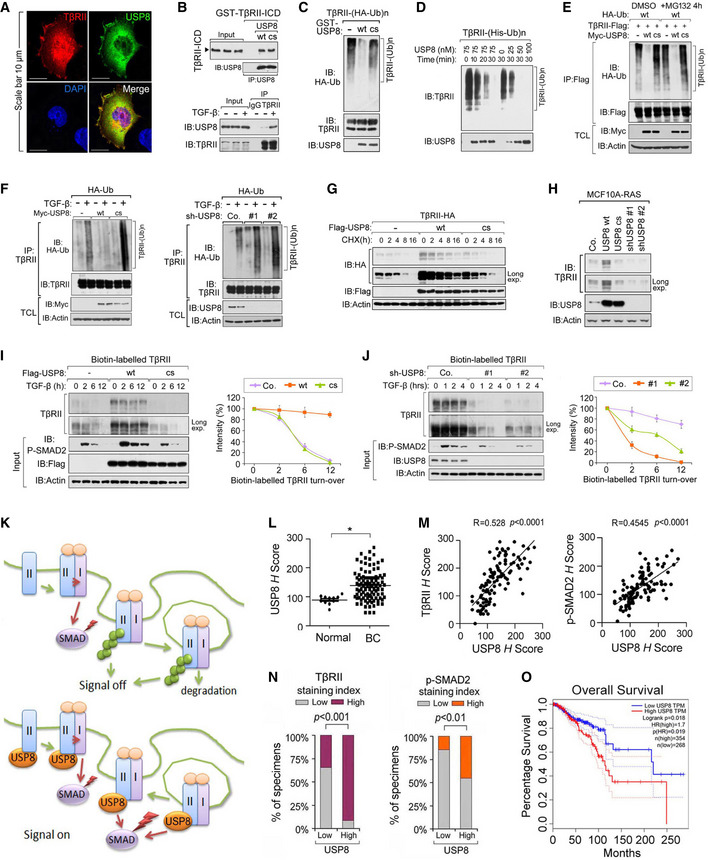
Fig 3. USP8 directly deubiquitinates TβRII and stabilizes TβRII at the plasma membrane.

-
AImmunofluorescence and DAPI staining of HeLa cells transfected with TβRII‐HA and Flag‐USP8. Scale bar, 10 μm.
-
BUSP8 interacts with TβRII. Purified prokaryotically expressed USP8 and recombinant GST‐TβRII‐ICD were incubated in vitro and immunoprecipitated with anti‐USP8 antibody; immunoprecipitates were then immunoblotted for TβRII‐ICD and USP8 (top panel); Immunoblot analysis of total cell lysate derived from MDA‐MB‐231 cells treated with TGF‐β as indicated and immunoprecipitated with control IgG (ns) or anti‐TβRII antibody (bottom panel).
-
CImmunoblot analysis of anti‐TβRII immunoprecipitates from HEK293T cells stably expressing HA‐Ub and in vitro incubated with purified USP8 wt/cs.
-
DIB of Nickle‐pull down precipitants derived from His‐Ub stably expressed HEK293T cells incubated with purified USP8 protein as indicated time points.
-
EIB of TCL and immunoprecipitants derived from HEK293T cells transfected with indicated plasmids and treated with or without MG132 (10 μM) for 4 h.
-
FIB of TCL and immunoprecipitants derived from HA‐Ub stably expressed HEK293T cells transfected with Myc‐USP8 wt/cs (left panel) or infected with control (Co.sh) or USP8 shRNA lentivirus (#1 and #2) (right panel) and treated with TGF‐β (5 ng/ml) as indicated.
-
GIB of HeLa cells stably expressing TβRII‐HA and transfected with control empty vector (Co.vector) and Flag‐USP8 wt/cs plasmids and treated with CHX (20 μg/ml) for indicated time points.
-
HImmunoblot analysis of MCF10A‐RAS cells stably expressing USP8 wt/cs or USP8 shRNA (#1 and #2).
-
IImmunoblot analysis of biotinylated TβRII in MDA‐MB‐231 cells ectopically expressing USP8 wt/cs and treated with TGF‐β (5 ng/ml) as indicated (left panel). Quantification of the band intensities is shown in the right panel. Band intensity was normalized to the t = 0 controls (right panel). n = 2 technical replicates.
-
JImmunoblot analysis of biotinylated TβRII in MDA‐MB‐231 cells infected with lentivirus encoding control shRNA (Co.sh), USP8 shRNA (# 1 and # 2) and treated with TGF‐β (5 ng/ml) as indicated (left panel). Quantification of the band intensities is shown in right panel. Band intensity was normalized to the t = 0 controls (right panel). n = 2 technical replicates.
-
KWorking model in which USP8 deubiquitylates TβRII thus maintains cell surface level of TβRII that sustains SMAD activation.
-
LExpression of USP8 of normal tissues (n = 11) and breast cancer patients (n = 110). Data are mean ± s.e.m. P‐values from Student's t‐tests were indicated.
-
MScatter‐plot showing the positive correlation of USP8, TβRII, and p‐SMAD2 expression in patients (n = 110). H score of every tissue samples of USP8, TβRII, and p‐SMAD2 was calculated. Pearson's coefficient tests were performed to assess statistical significance.
-
NPercentage of specimens displaying low or high USP8 expression compared with the expression levels of TβRII and P‐SMAD2 in human breast cancer tissue (n = 110). P‐values from Student's t‐tests were indicated.
-
OGEPIA analysis curves showing the metastasis‐free survival of breast cancer patients was significantly correlated with USP8 expression by the log‐rank test in the TCGA and GTEx datasets (http://gepia.cancer‐pku.cn/). Cutoff‐high = 67%, cutoff‐low = 25%.
Data information: *P < 0.05 (two‐tailed Student's t‐test (L), two‐way ANOVA (I, J), Pearson's correlation test (M), log‐rank (O)). Data are shown as mean ± SD (I, J, L).
Source data are available online for this figure.
