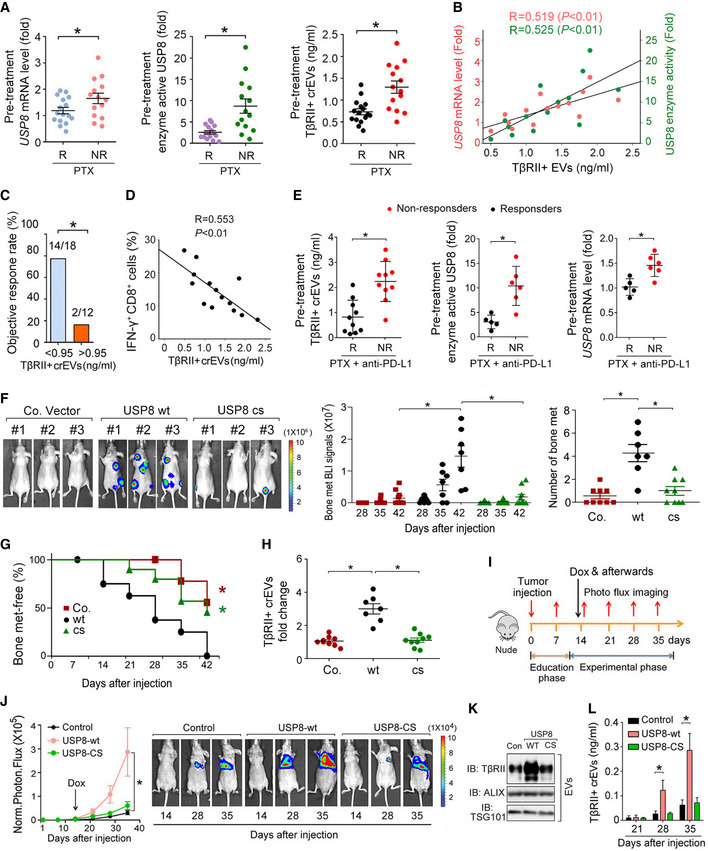
Fig 4. Gain of USP8 function promotes the secretion of EV‐TβRII during metastasis.

-
AComparison of the pretreatment levels of USP8 mRNA in patient‐derived tissue samples by qRT–PCR (left panel), enzyme activity of USP8 in patient‐derived tissue samples by Ub‐VME (middle panel), and TβRII+ crEV level in the plasma from breast cancer patients by ELISA (right panel) between breast cancer patients with or without clinical response to PTX. R, responders; n = 16; NR, nonresponders; n = 14.
-
BPearson correlation of the USP8 mRNA or USP8 enzyme activity in patient‐derived tissue samples with the EV‐TβRII levels in the plasma from breast cancer patients without clinical response to PTX as in (A) (NR, n = 14).
-
CObjective response rate (ORR) for patients as in (A) (n = 30) with high (>0.95 ng/ml) and low (<0.95 ng/ml) pretreatment levels of circulating EV‐TβRII.
-
DPearson correlation of the percentage of IFN‐γ+ of CD8+ cells to the TβRII+ crEV level in the plasma from breast cancer patients without clinical response to PTX as in (A) (NR, n = 14).
-
ETβRII+ crEVs (left panel), the USP8 enzyme activity (middle panel), and USP8 mRNA (right panel) from breast cancer patients with or without clinical response to combined therapy using anti‐PD‐L1 (Atezolizumab) and paclitaxel. R, responders; n = 10 (left panel), n = 5 (middle and right panels, only 5 patient‐derived tissue samples obtained). NR, nonresponders; n = 10 (left panel), n = 6 (middle and right panels, only 5 patient‐derived tissue samples obtained).
-
F–HExperimental procedure in vivo: MDA‐MB‐231 cells were intracardially injected into nude mice. Bioluminescent imaging (BLI) of representative mice from each group at week 6 injected with control (n = 9) or MDA‐MB‐231 cells stably overexpressed with USP8‐WT (n = 7) or USP8‐CS (n = 9). BLI images are shown (F (left panel)). BLI signal of each mice (F (middle panel)) and the number of bone metastasis (F (right panel)) of every mouse, and the percentage of bone metastasis‐free mice survival in each experimental group followed in time (G). Fold change of circulating EV‐TβRII by ELISA analysis in plasma samples of mice in each experimental group at week 6 (H).
-
I–LExperimental procedure in vivo: nude mice were tail vein‐injected with 4T07‐Luc cells (5 × 10⁵ cells per mouse) expressing control vector or doxycycline‐inducible USP8‐wt/cs and tumors were grown for 2 weeks, followed by the administration of doxycycline (n = 6 for each group) (I). Normalized BLI signals (left panel) and representative mice (right panel) from each group at the indicated times (J). Immunoblot analysis of the circulating EVs from plasma in mice (K). ELISA analysis of circulating exosomal TβRII level in plasma samples of mice at the indicated times (L).
Data information: *P < 0.05 (two‐tailed Student's t‐test (A, C, E, F, H, L), Pearson's correlation test (B, D), two‐way ANOVA (G, J (left))). Data are shown as mean + SD (L) or as mean ± SD (A, E, F, H, J (left)).
Source data are available online for this figure.
