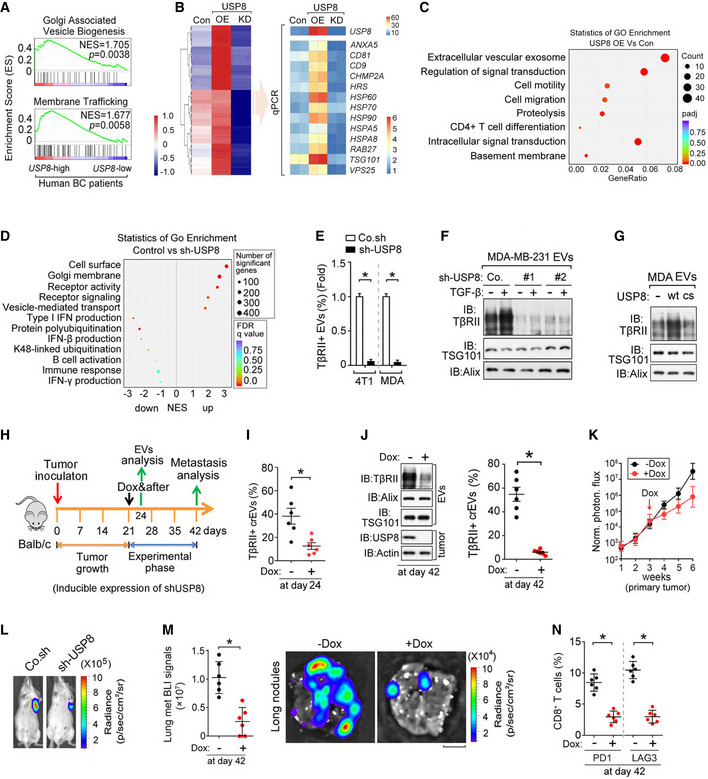
Fig 5. The TβRII levels in crEVs are dependent on deubiquitination by USP8.

-
AGene signatures indicating the Golgi‐associated vesicle biogenesis‐ and membrane trafficking‐related genes are significantly enriched in USP8‐high (n = 38) patients versus USP8‐low (n = 39) expressing patients; shown by preranked gene‐set enrichment analysis (GSEA).
-
BHeatmap shows the upregulated genes upon USP8 overexpression and the downregulated genes upon USP8 depletion when compared with control MDA‐MB‐231 cells by RNA‐seq analysis (left panel). qRT–PCR analysis of control or MDA‐MB‐231 cells stably overexpressing USP8 (USP8 OE) or USP8 shRNA (right panel).
-
CGo enrichment analysis of significantly altered gene sets in USP8 overexpressed MDA‐MB‐231 cells versus control.
-
DGo enrichment analysis of significant up‐ and downregulated gene sets in control versus USP8‐depleted MDA‐MB‐231 cells.
-
EFACS analysis of EVs from 4T1 and MDA‐MB‐231 cells infected with lentivirus encoding control shRNA (Co.sh) or USP8 shRNA.
-
FImmunoblot analysis of EVs from MDA‐MB‐231 cells infected with lentivirus encoding control shRNA (Co.sh) or USP8 shRNA (#1 & #2).
-
GImmunoblot analysis of the EVs derived from MDA‐MB‐231 cells ectopically expressing USP8 wt/cs.
-
HExperimental procedure in vivo: BALB/c mice were nipple injected with 4T1‐Luc cells (5 × 10⁵ cells per mouse) expressing control shRNA or doxycycline‐inducible shRNA‐targeting USP8 (shUSP8), and tumors were grown for 3 weeks, followed by the administration of doxycycline for 3 weeks (n = 6 for each group).
-
IQuantification of the percentage of TβRII+ crEVs in plasma samples from mice at day 24.
-
JImmunoblot analysis of tumor and the TEVs (left panel) and quantification of the percentage of TβRII+ EVs (right panel) in plasma samples from mice at day 42.
-
KNormalized photon flux at the indicated times.
-
LRepresentative BLI signals of the primary tumor in each group at day 42 after implantation of 4T1 cells (2 × 10⁵ cells per mouse, n = 6 per group).
-
MNormalized BLI signals (left panel) and bioluminescent images (right panel) of the lung metastasis nodules. Scale bars, 2 mm.
-
NPercentage of CD8+ T cells of tumor‐draining lymph nodes (TDLN) at day 42.
Data information: *P < 0.05 (two‐tailed Student's t‐test (E, I, J (right), M (left), N) or two‐way ANOVA (K). Data are representative of at least three independent experiments and shown as mean + SD (E); Data are shown as mean ± SD (I, J (right), M (left), N).
Source data are available online for this figure.
