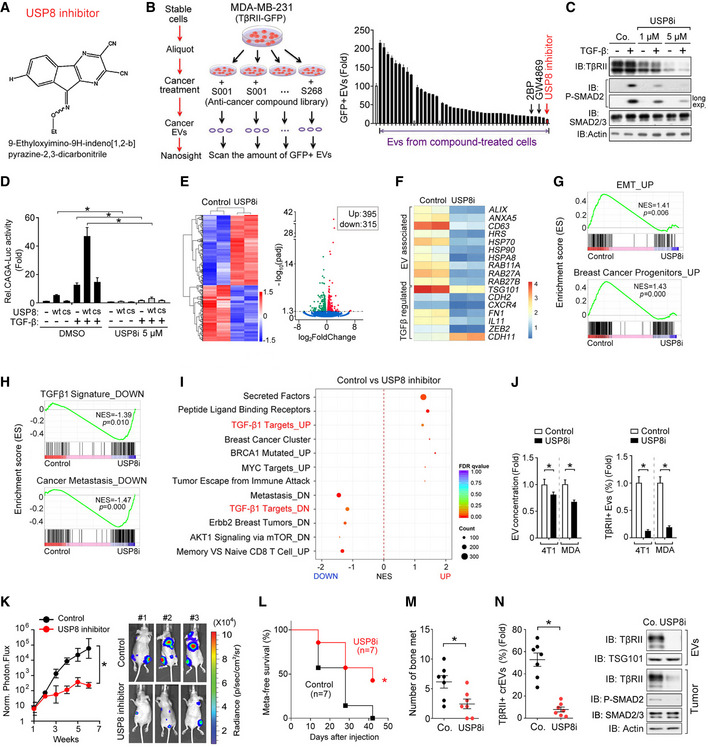
Fig 6. Pharmacological inhibition of USP8 represses TGF‐β signaling and prevents the exosomal secretion of TβRII.

-
AStructure of the USP8 inhibitor, 9‐ethyloxyimino‐9H‐indeno [1,2‐b] pyrazine‐2,3‐dicarbonitrile.
-
BLeft: screening procedure for cellular components critical for the secretion of EV‐TβRII; Right: nanosight analysis of GFP positive EVs derived from MDA‐MB‐231 cells expressing TβRII‐GFP and pretreated with anti‐cancer compounds. n = 3 technical replicates.
-
CImmunoblot analysis of total cell lysates derived from MDA‐MB‐231 breast cancer cell treated with USP8 inhibitor and TGF‐β (2.5 ng/ml) as indicated.
-
DEffect of USP8 inhibitor (5 μM) on SMAD3/SMAD4‐dependent CAGA12‐Luc transcriptional response induced by TGF‐β (2.5 ng/ml) for 16 h in HEK293T cells transfected with control vector (Co.vec) or USP8 wt/cs. n = 3 biological replicates.
-
EHeatmap shows differentially expressed genes in control DMSO‐treated or USP8 inhibitor (5 μM)‐treated MDA‐MB‐231 cells for 24 h (left panel). Volcano plot of transcriptome profiles between control and USP8 inhibitor‐treated MDA‐MB‐231 cells (right panel). Red and green dots represent genes significantly upregulated and downregulated in control MDA‐MB‐231 cells. (P < 0.05, false discovery rate [FDR] < 0.1).
-
FqRT–PCR analysis of control (DMSO‐treated) or USP8 inhibitor (5 μM for 24 h) treated MDA‐MB‐231 cells. Relative mRNA levels are shown as a heatmap.
-
GGene signatures indicating the upregulated epithelial‐mesenchymal transition (EMT) (upper panel) and breast cancer progenitors‐related gene set (bottom panel) are significantly enriched in control cells; shown by preranked gene‐set enrichment analysis (GSEA).
-
HThe downregulated TGF‐β signaling (upper panel) and metastasis‐related gene sets (bottom panel) are significantly enriched in USP8 inhibitor‐treated MDA‐MB‐231 cells; shown by preranked gene‐set enrichment analysis (GSEA).
-
IGo enrichment analysis of significant up‐ and downregulated gene sets in control DMSO versus USP8 inhibitor‐treated MDA‐MB‐231 cells.
-
JThe total concentration of EVs by nanosight analysis (left) and the percentage of TβRII+ EVs by FACS (right) from 4T1 and MDA‐MB‐231 cells treated with USP8 inhibitor (5 μM) for 24 h. n = 3 technical replicates.
-
K–NExperimental procedure in vivo: MDA‐MB‐231‐Luc cells (1 × 10⁵ per mouse) were intracardially injected into nude mice (n = 7 for each group). USP8 inhibitor (1 mg/kg) was injected on day 1 via intraperitoneal injection every the other day for 3 weeks. Normalized BLI signals (left panel) and BLI imaging of three representative nude mice from each group at week 6 (right panel) were shown (K). Percentage of metastasis‐free survival in each experimental group followed in time (L). Number of bone metastasis nodules (M). Percentage of TβRII+ crEVs in plasma samples from mice (left panel) and immunoblot analysis of metastatic tumor nodule in mice and circulating EVs from plasma (right panel) (N).
Data information: *P < 0.05 (two‐tailed Student's t‐test (D, J, M, N (left)) or two‐way ANOVA (K, L)). Data are shown as mean + SD (B, D, J) or as mean ± SD (K, M, N (left)).
Source data are available online for this figure.
