An official website of the United States government
Here's how you know
Official websites use .gov
A
.gov website belongs to an official
government organization in the United States.
Secure .gov websites use HTTPS
A lock (
) or https:// means you've safely
connected to the .gov website. Share sensitive
information only on official, secure websites.
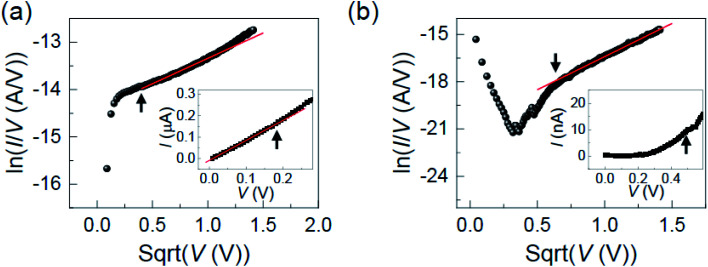
 for the forward I–V curve in the positive voltage region of (a) the first and (b) the second Bayesian endmembers. The insets in (a) and (b) show the current responses for the small voltage regions. The solid red lines in (a) and (b) show the linear fitting results. The arrows in (a) and (b) indicate the same voltage values.