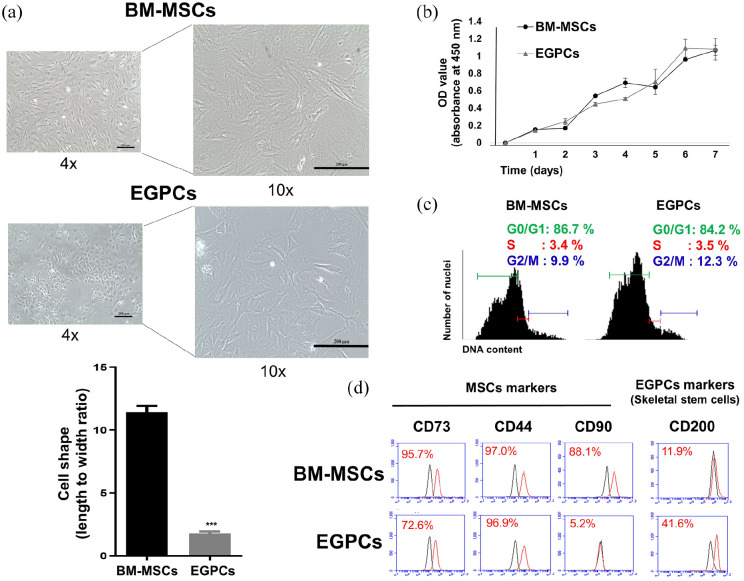
Figure 2.
Cellular characterization of EGPCs and BM-MSCs: (a) observation of cell morphology and measurement of cell shape (length to width ratio), (b) the proliferation rates of EGPCs and BM-MSCs were measured from day 1 to day 7 by the CCK-8, (c) cell-cycle analysis of BM-MSCs and EGPCs by using propidium-iodide staining. Quantitation of the cells at each-cycle phase, and (d) Flow-cytometric analyses for the surface markers on BM-MSCs and EGPCs. Representative flow-cytometry profiles are depicted for CD73, CD44, CD90, and CD200. Black and red plots represent the negative control and experimental samples, respectively.

