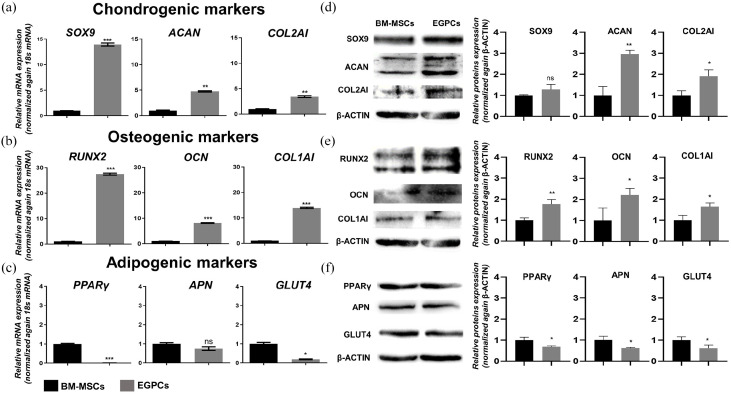
Figure 3.
Molecular characterization of EGPCs and BM-MSCs. (a–f) Expression levels of chondrogenic (SOX9, ACAN, and COL2A1), osteogenic (RUNX2, OCN, and COL1A1), and adipogenic (PPARγ, APN, and GLUT4) factors, as assessed via quantitative reverse transcription–polymerase chain reaction (qRT-PCR) and western blotting. qRT-PCR data were normalized against the level of 18S RNA, whereas the western-blot data were normalized against the level of β-ACTIN. The data are representative of two independent experiments performed in triplicate. mean ± SEM; ns: not significant, *p < 0.05, **p < 0.01, ***p < 0.001. Individual data points and p-values for significance are indicated on the graph.

