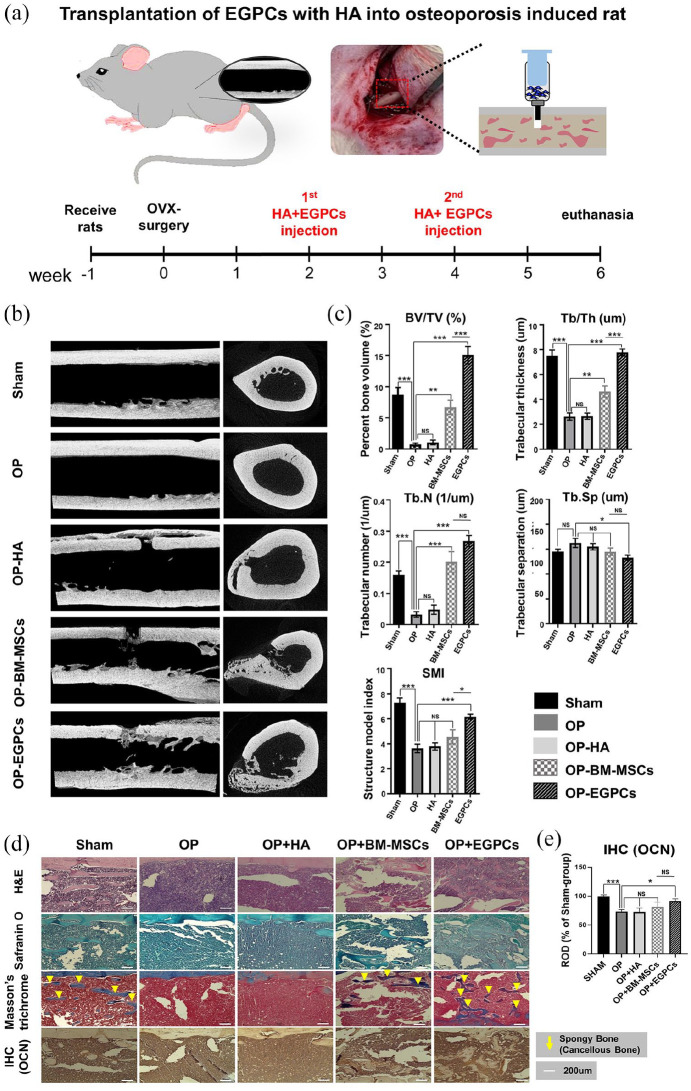
Figure 5.
In vivo bone regeneration potential of EGPCs in an osteoporosis model: (a) time schedule of in vivo experiment for bone formation in the osteoporosis model upon injection of EGPCs and BM-MSCs. Rats received OVX-surgery at 9 weeks of age. They received HA + EGPCs injection on the long bone at 2 and 4 weeks after OVX, respectively. After the end of the experiments, femur was removed and analyzed for micro-CT and bone histo-staining, (b) images of micro computed tomography, demonstrating the three-dimensional (3D) reconstructed image 2 weeks after the last cell injection, (c) bone histomorphometry of the 3D bone formation was analyzed in an ROI for all the groups. The plots of the parameters are structure model index (SMI), percent bone volume (BV/TV, %), trabecular thickness (Tb.Th, µm), trabecular number (Tb.N, 1/µm), and trabecular separation (Tb.Sp, µm); n = 6 animals per group, mean ± SEM; ns: not significant, *p < 0.05, **p < 0.01, ***p < 0.001, (d) histological evaluation of a rat femur 6 weeks after induced osteoporosis. Hematoxylin in and Eosin staining (upper panel); Safranin O staining (middle panel); Masson’s Trichrome staining (bottom panel). In Masson’s Trichrome staining, the blue and red colors indicate recently formed and calcified bones, respectively, and (e) quantitative analysis of IHC for OCN. A histogram of OCN staining intensity expressed as relative optical density (ROD) of brown reaction products.

