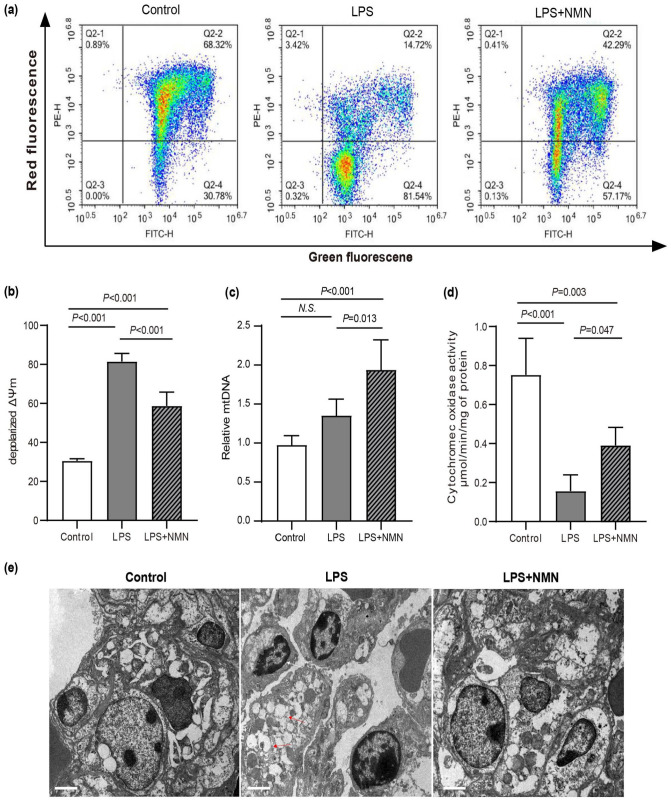
Figure 3.
Effects of NMN on mitochondrial function. (a) Mitochondrial membrane potential (ΔΨm) analyzed by flow cytometry. Q2-2, red fluorescence+/green fluorescence+, polarized ΔΨm; Q2-4, red fluorescence–/green fluorescence+, depolarized ΔΨm. (b) Quantitative histogram of ΔΨm. (c) Relative mtDNA content using real-time PCR. (d) Cytochrome c oxidase activity in mice. Statistical difference was calculated by one-way ANOVA (n = 5/group). (e) The morphological alterations of mitochondria and the nucleus were observed by transmission electron microscopy. Scale bars, 2 μm. Red arrows denoted abnormal mitochondria, which were manifested as isolated, swollen, and vacuolization mitochondria without clear cristae. White arrows denoted unusual nucleus size and shape, pyknotic nuclei, and irregular nuclear membrane. All the results were obtained from three independent experiments. (A color version of this figure is available in the online journal.)

