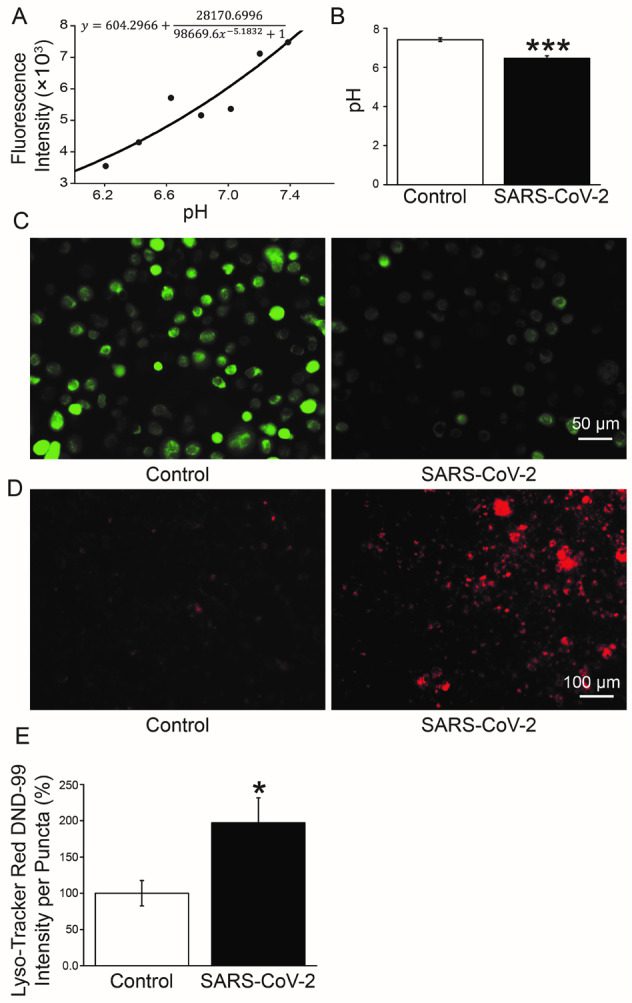
Fig. 3. Measurement of intracellular/lysosome pH in A549 cells.

A The standard curve of fluorescence intensity of BCECF and intracellular pH value by flow cytometry. B pH values of A549 cells in Control and SARS-CoV-2 group. ***P < 0.001, compared with Control. n = 6, one-way ANOVA followed by Bonferroni’s test was used to analyze the difference of the means. C Fluorescent intensity of BCECF. D Lyso-Tracker Red DND-99 staining. E Mean Lyso-Tracker Red DND-99 fluorescence intensity per punctum in A549 cells. n = 5, Mann–Whitney U test was used to analyze the difference of the means for significance.
