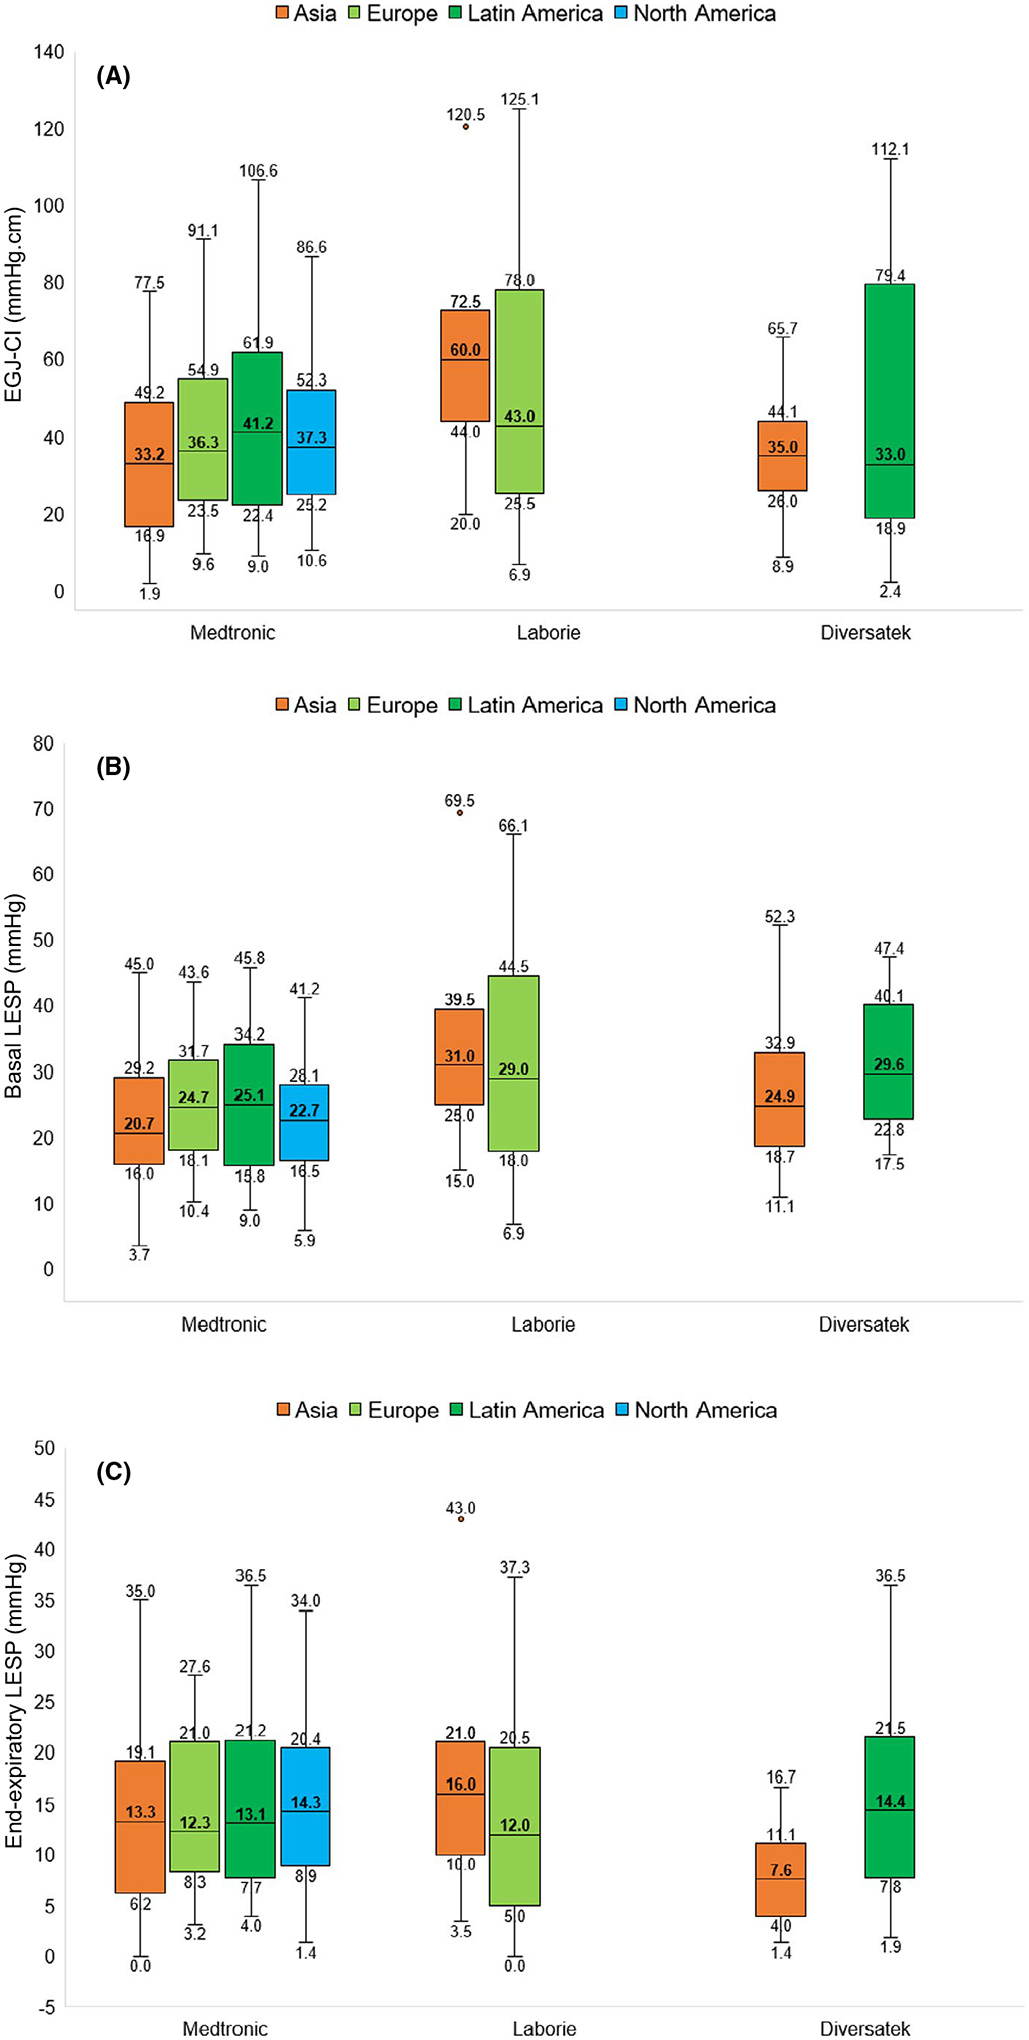
FIGURE 4.

Variation in esophagogastric junction (EGJ) function assessment (A: EGJ contractile integral (EGJ-CI), B: basal lower esophageal sphincter pressure (LESP), C: end-expiratory LESP) across world regions displayed using box and whisker plots. The extents of the box plots represent 25th-75th percentile values, and the whiskers depict 5th and 95th percentile values. The horizontal line within the boxes depicts the median value in bold font. Values were generally consistent within each measurement system across world regions, while values were significantly different between systems, even when assessed within the same world region.
