
Figure 1.
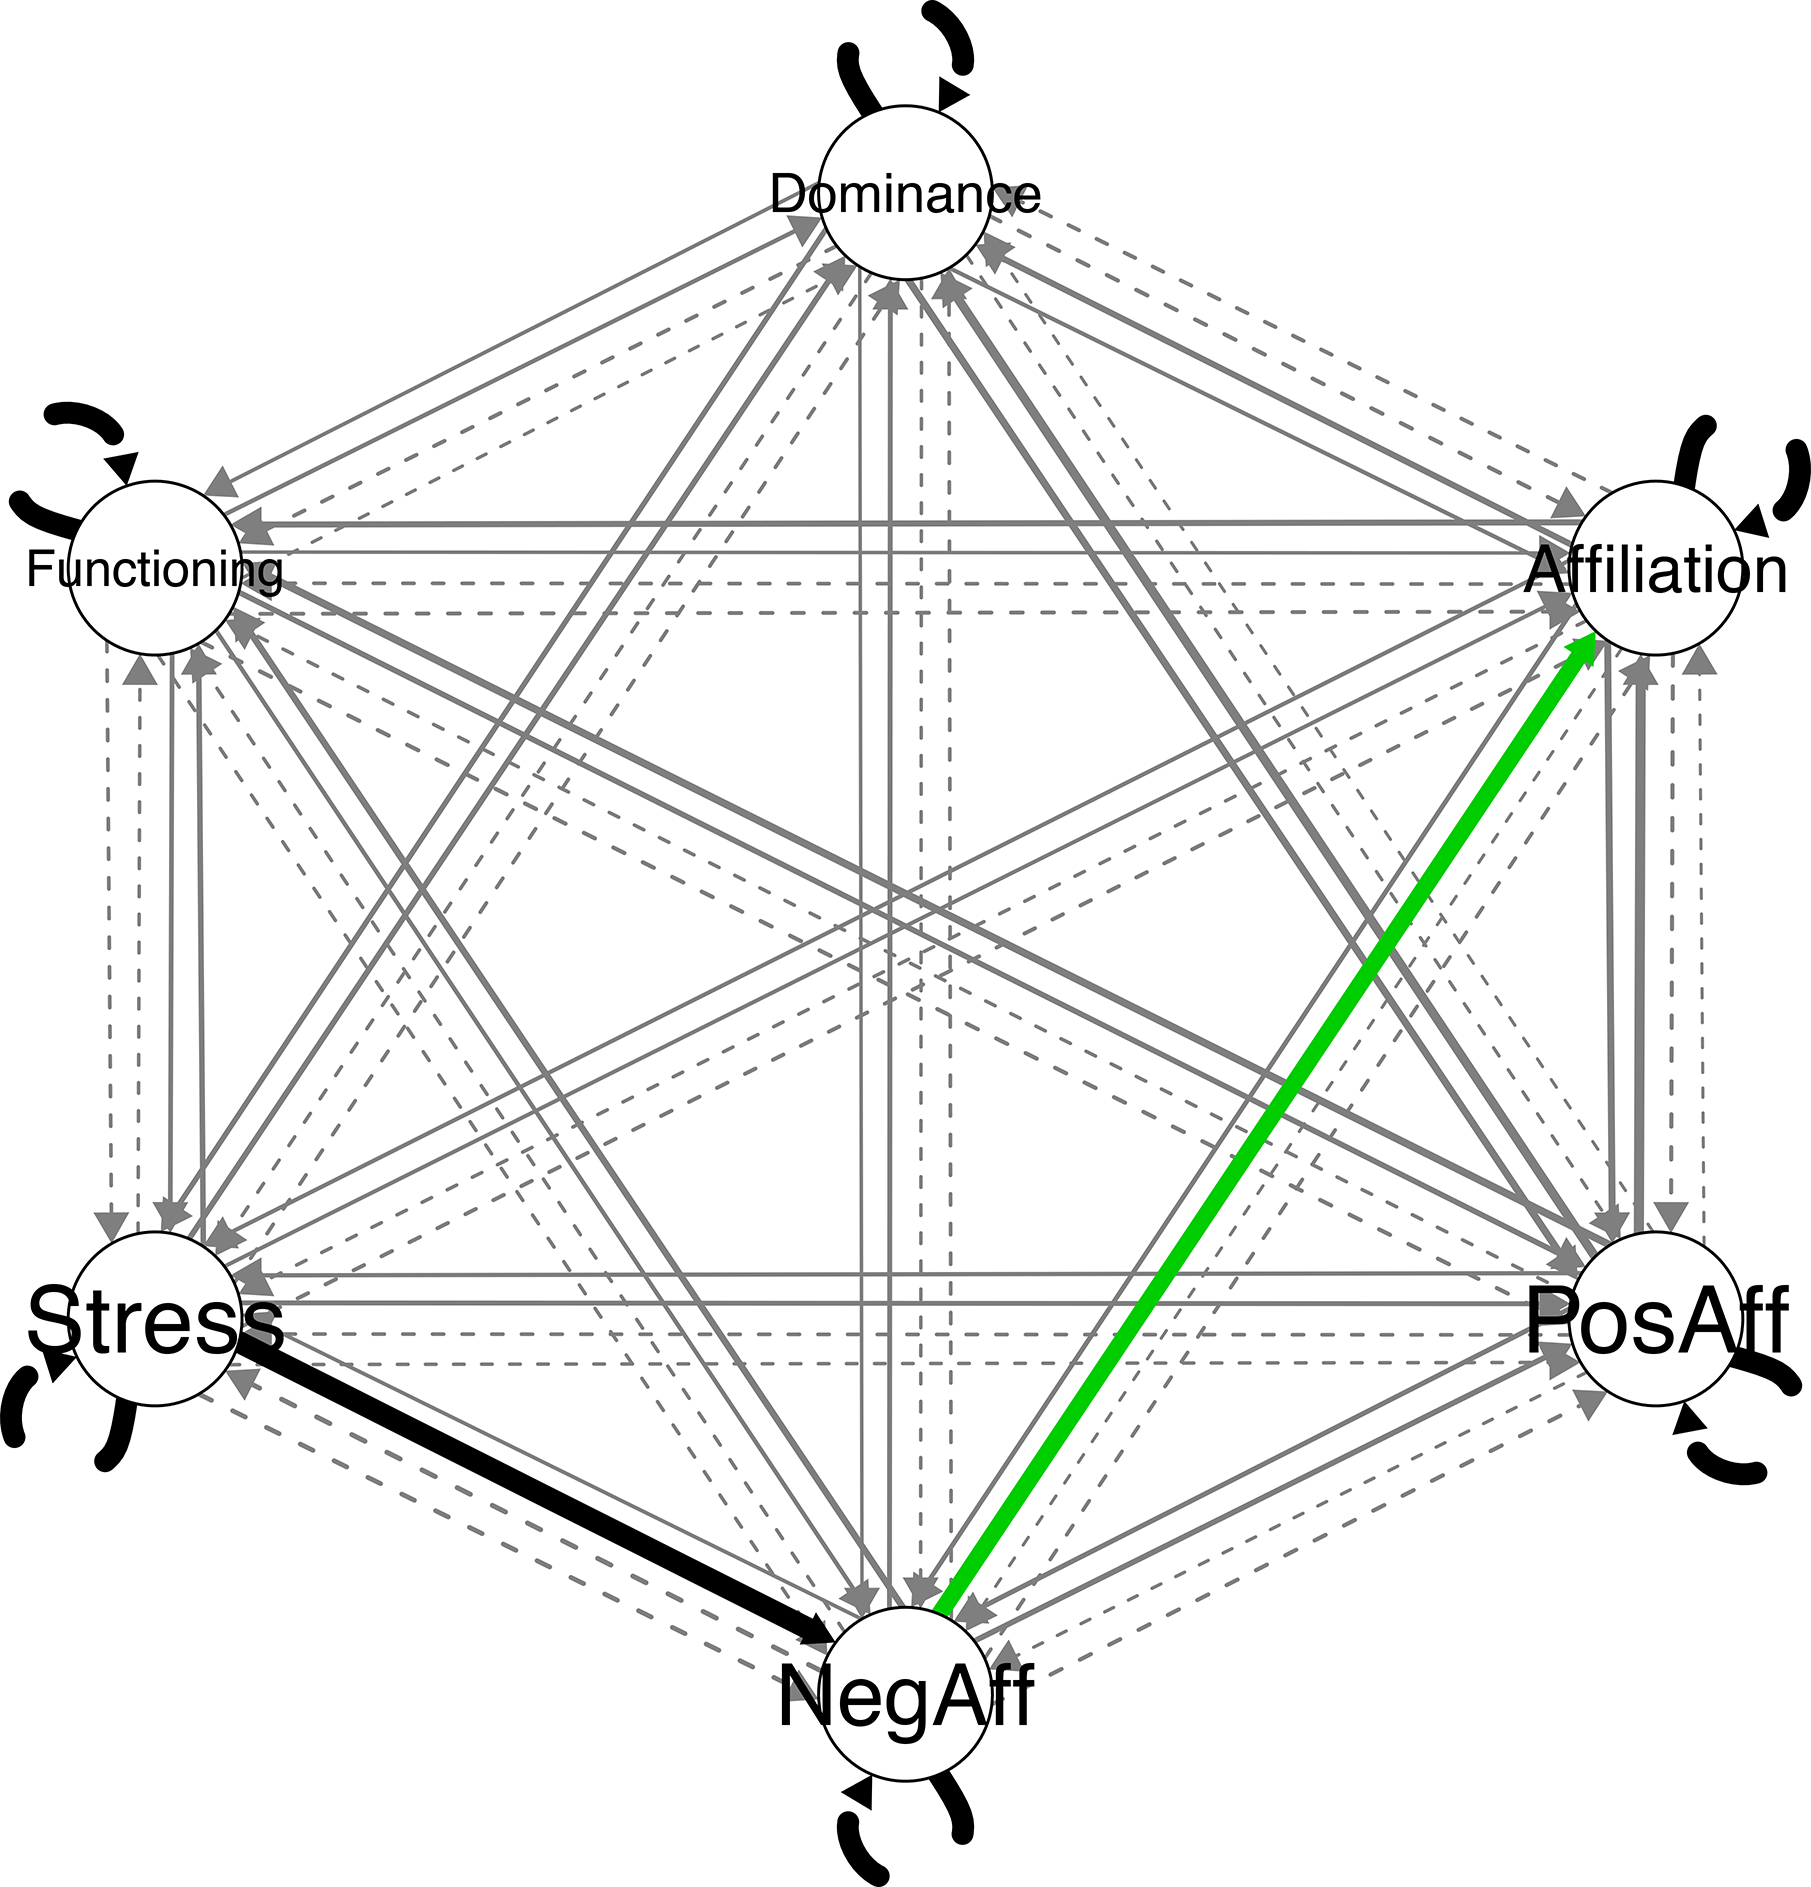
Diagram of all general (group), shared (subgroup), and person-specific (individual) paths estimated in group iterative multiple model estimation. Group level paths are in black, subgroup paths are in green, and individual paths are in gray. Line thickness indicates the number of individuals with the path. Contemporaneous effects are represented with solid lines, and lagged effects are represented with dashed lines.