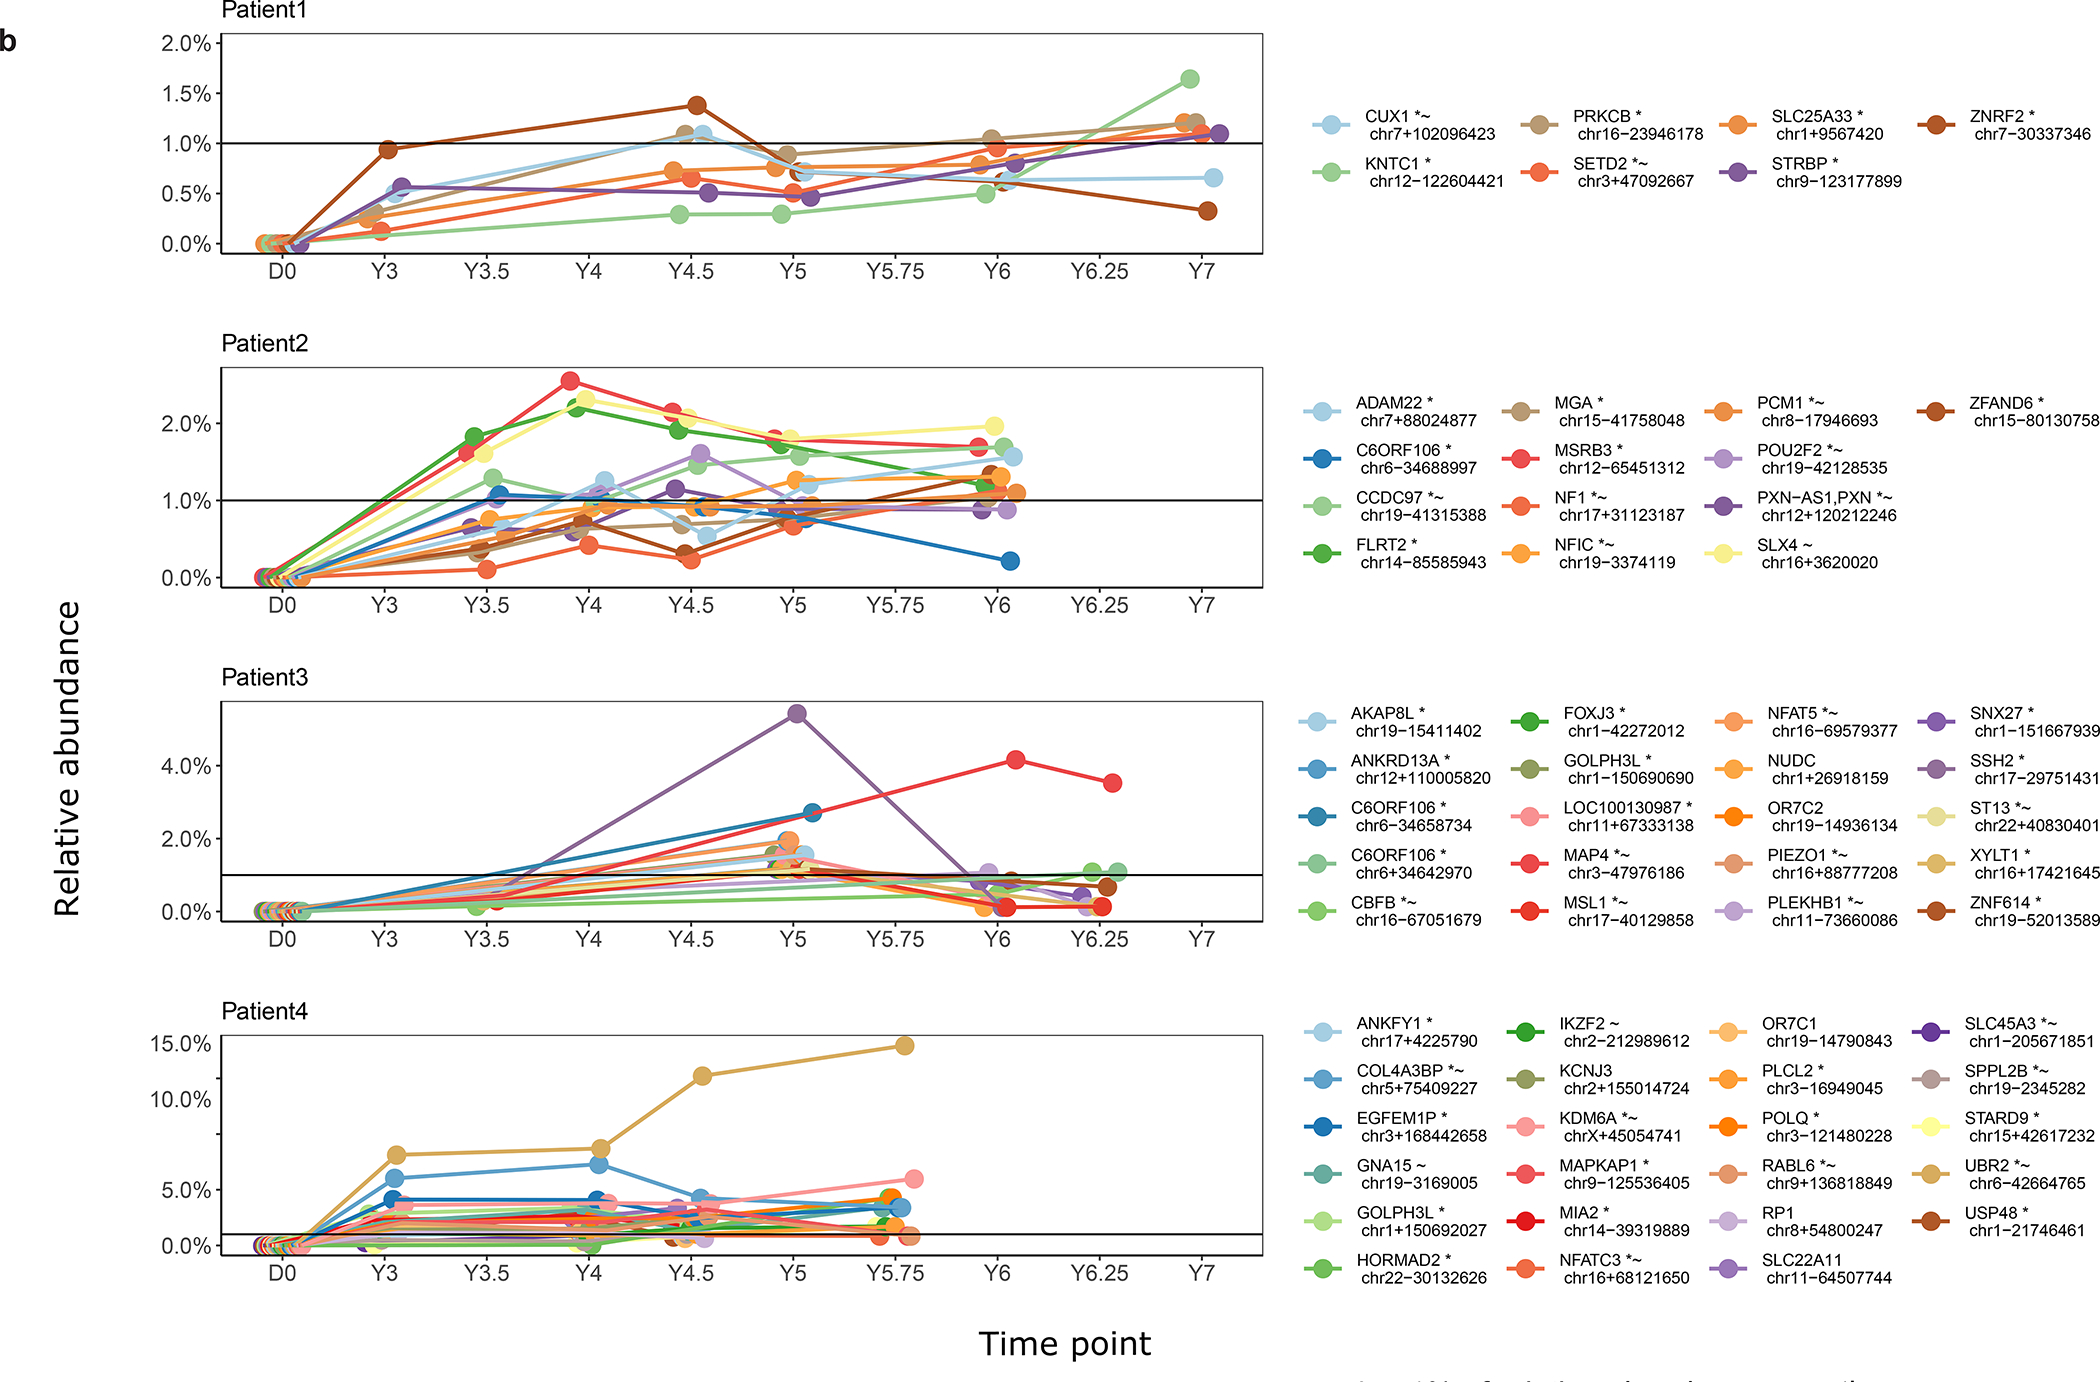
Fig. 3 |. Long-term clonal abundance and succession in all patients.


a, Longitudinal relative abundance of the 10 most abundant cell clones in whole blood as marked by lentiviral integration sites. The different colors (horizontal bars) indicate the top 10 most abundant cell clones while the remaining sites are binned as low abundance (LowAbund; grey). The x-axis indicates time points after infusion and the y-axis is scaled by proportion of the total cells sampled. The total number of genomic fragments used to identify integration sites are listed atop of each plot.
A key to the sites, named for the nearest gene, is shown on the right side of the graphs. The nearest genes possess additional annotations: *site is within a transcription unit; ~ site is within 50kb of human cancer-related genes.
b, Cell clones surpassing 1% of relative abundance over time. Longitudinal representation of relative abundance of cell clones in whole blood as marked by lentiviral integration sites.
