
Extended Data Fig. 2 |. β-globin expression in Patient 2 at 12 months post treatment.
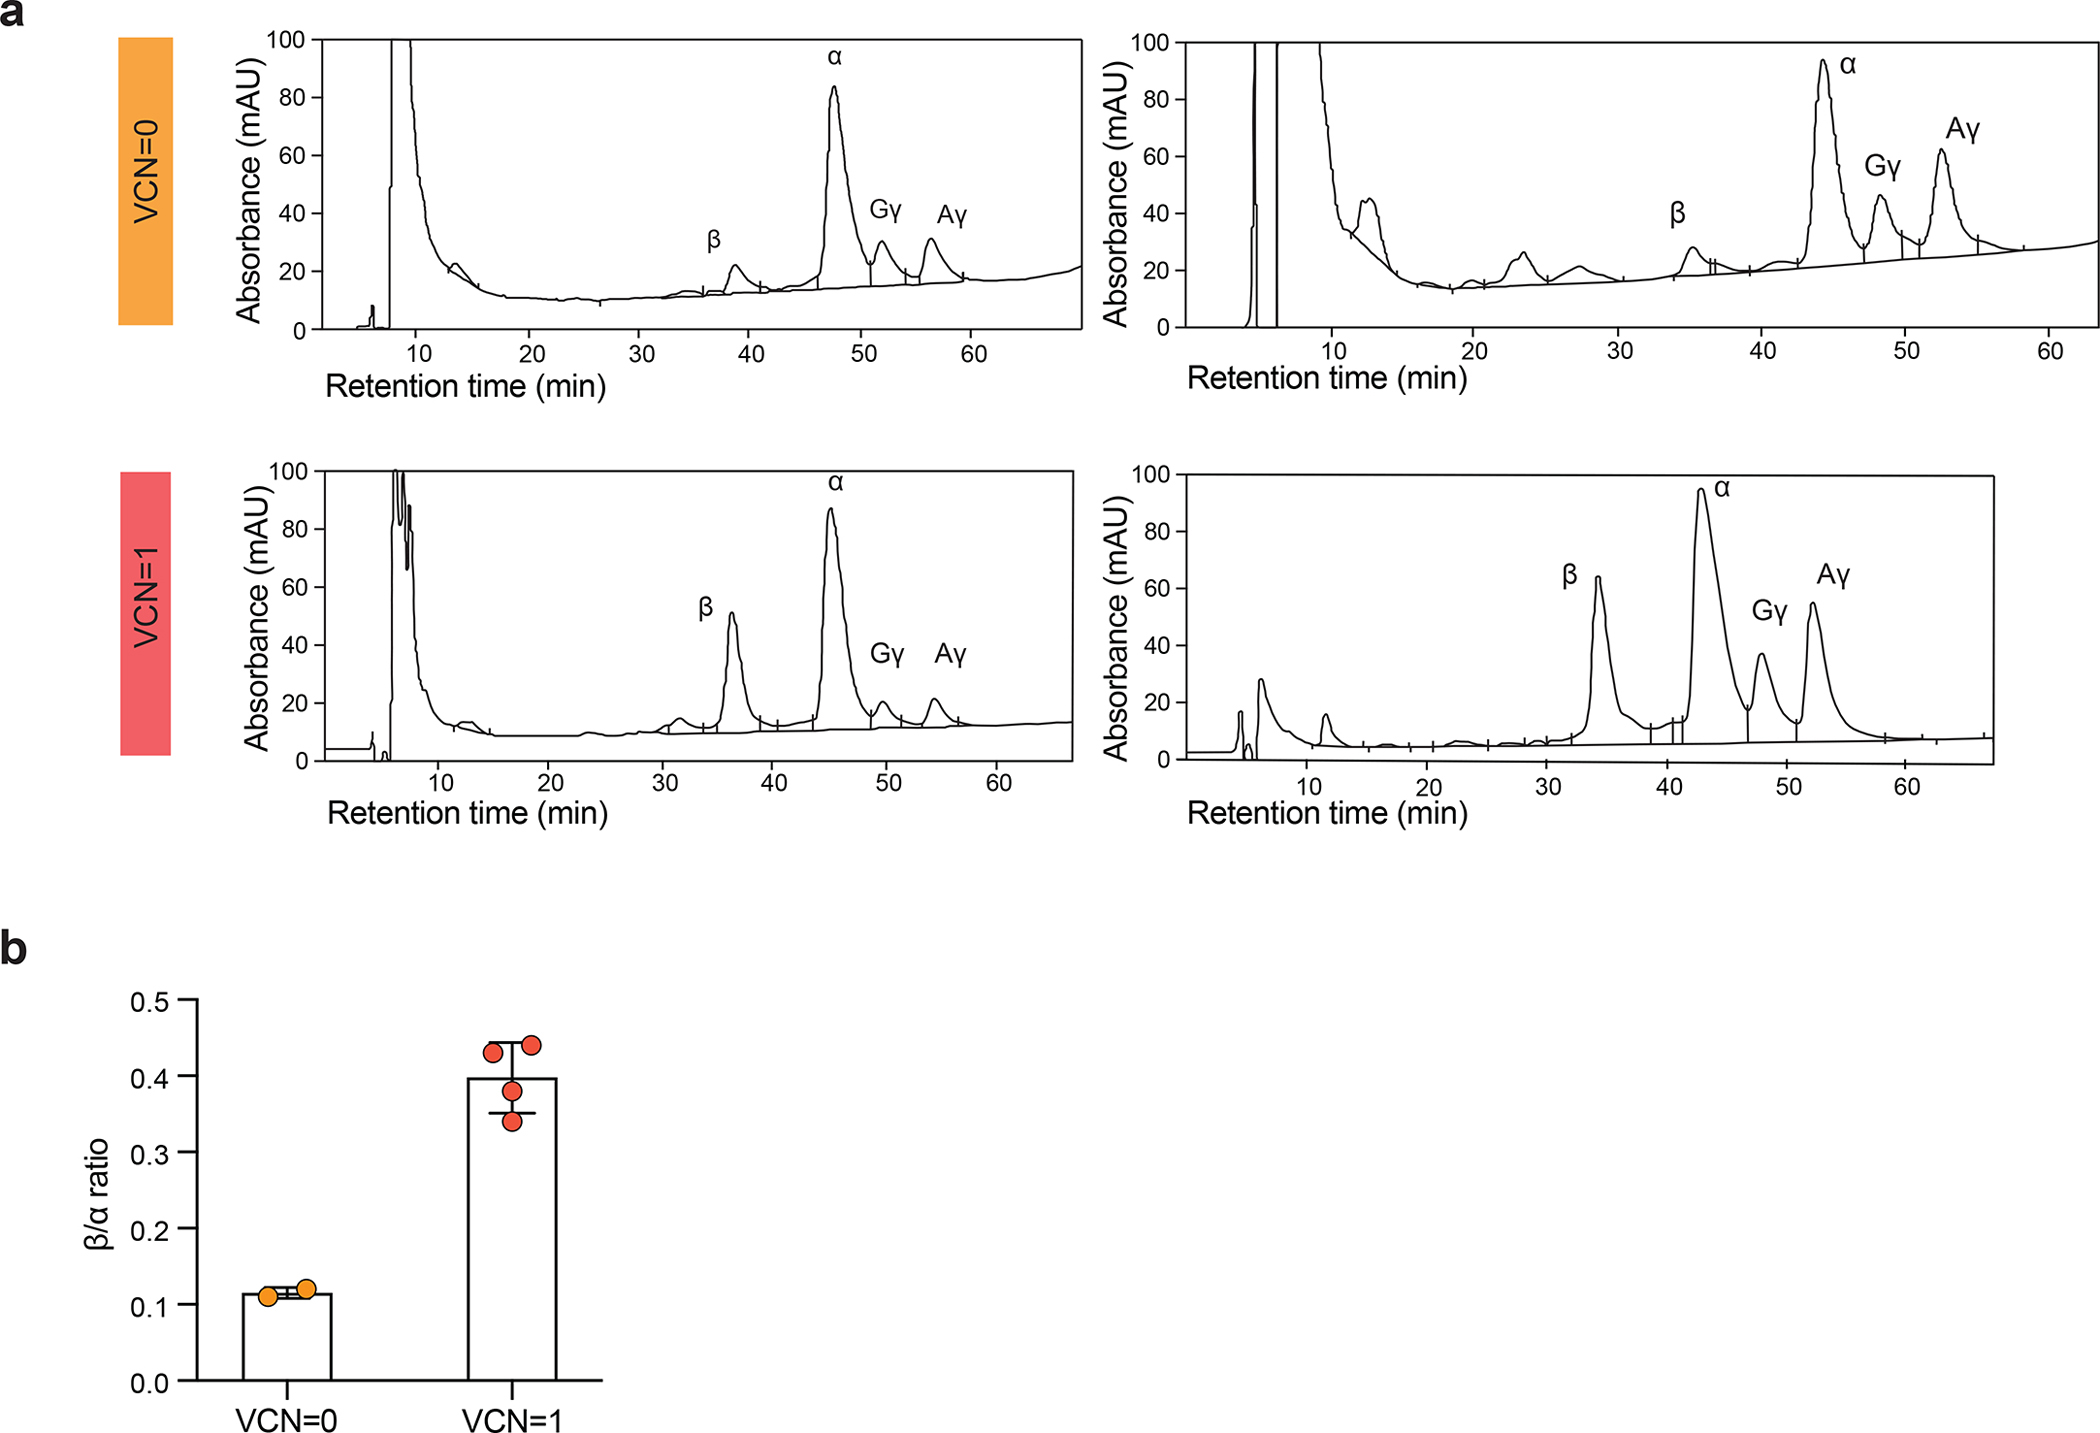
a, HPLC chromatograms illustrating globin production of eythroid cells from four individual BFU-Es derived from bone marrow obtained from Patient 2 at 12 months post infusion.
Top chromatograms: two representative examples from two individual, non-transduced BFU-E from Patient 2; lower chromatograms: two representative examples from two individual, transduced BFU-E from Patient 2. b, β-globin to α-globin ration in erythroids derived from untransduced and transduced HSCs obtained from Patient 2 at 12 months post infusion.
The β/α expression ratio determined by HPLC in single BFU-Es increased from a mean of 0.11 to 0.38 in BFU-Es harboring a single copy of the integrated vector, representing a gain of 0.27.