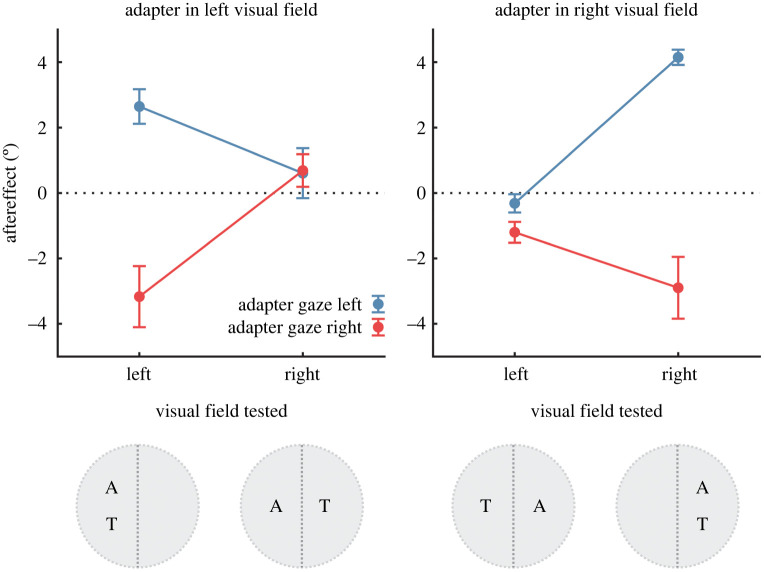
Figure 2.
Perceptual aftereffects averaged across the sample. The data are plotted as a function of the visual field location of the adapting and test stimuli. Aftereffects are shown here as the difference in the perceived gaze direction of test stimuli before and after adaptation. Positive aftereffects indicate a shift in the perceived angle of gaze toward the right following adaptation, and negative aftereffects indicate a shift in the perceived angle of gaze toward the left. Markers show the mean ± 1 s.e., and colour indicates whether the adapting stimulus had leftwards or rightwards gaze direction. The results show that perceived gaze direction was biased away from the gaze direction of the adapting stimulus, but only when the adapting and test stimuli were presented in the same side of the visual field. (Online version in colour.)

