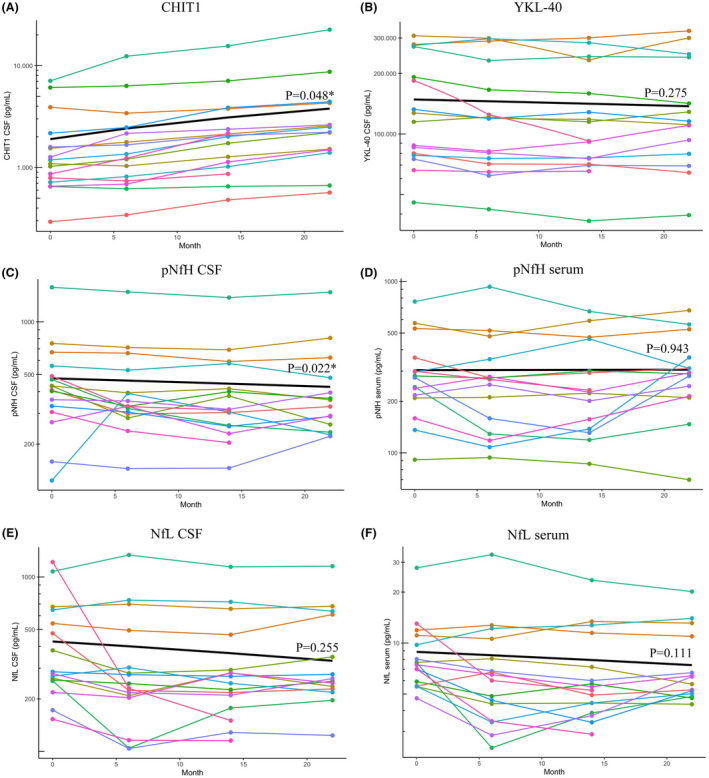
Figure 1.

Evolution of CSF and serum biomarkers over 22 months of nusinersen treatment in adults with SMA. All figures have a log10 transformed y‐axis, with values from the measurement range of each specific biomarker added on the y‐axis for optimal readability. Each patient is represented by an individual colored line. For 2/16 patients, biomarker measurements at month 22 were not available. (A) CHIT1 concentrations increase significantly over 22 months of treatment with nusinersen. (B) YKL‐40 levels decline during the study, but this change is not significant. (C and D) pNfH in CSF decreases significantly throughout the study, but pNfH levels in serum remain unchanged. For one patient, serum pNfH levels were unmeasurable low. (E and F) Both NfL in CSF and in serum show decreasing trends that are not significant. *Denotes a significant p‐value. Abbreviations: CHIT1, chitotriosidase‐1; YKL‐40, chitinase‐3‐like protein 1; CSF, cerebrospinal fluid; pNfH, phosphorylated neurofilament heavy chain; NfL, neurofilament light chain.
